Thesis Data Analysis Excel Template | Research Toolkit | Free Sample Download | Complete Pack
$20.00Original price was: $20.00.$5.00Current price is: $5.00.
PRODUCT OVERVIEW
A complete thesis data analysis workbook designed to help students and academic researchers organize research data, perform common statistical analysis, create charts, and prepare clear results for thesis reporting. The package includes an Excel-based research workflow with formula-driven analysis and a Google Sheets-ready version for flexible use.
It is built for researchers who need more than a basic data-entry sheet and want a structured way to move from raw questionnaire data to descriptive statistics, statistical tests, visual results, and thesis-ready analysis.
Turn Your Research Data Into Organized, Usable Results
Managing thesis data can become difficult when questionnaire responses, variables, statistical calculations, charts, and research notes are spread across different files.
This thesis data analysis Excel template brings those tasks into one structured research workbook. Instead of starting a statistical workbook from zero, you can organize your variables and research data, apply analysis workflows, review calculated results, and work with charts from the same package.
The workbook is designed as a practical thesis research data analysis template for students and researchers working with survey and quantitative research data.
What You Can Do With the Workbook
Use the workbook to organize and analyze research data through a structured workflow that can include:
Research setup and variable organization
Data entry and data-quality checks
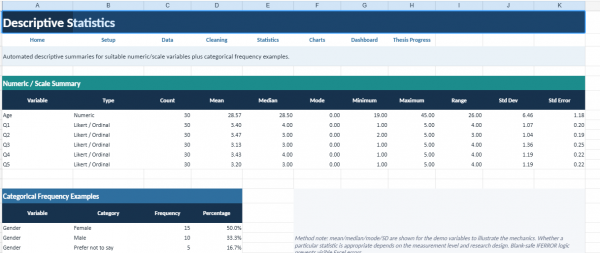
Descriptive statistics
Frequency and percentage analysis
Likert-scale analysis
Cross-tabulation
Pearson and Spearman correlation analysis
Reliability analysis including Cronbach’s Alpha
Reverse coding and composite/scale scoring
Normality and assumption-related checks
t-test analysis
ANOVA analysis
Chi-square analysis and association measurement
Regression analysis
Effect-size calculations such as Cohen’s d and Hedges’ g
Confidence-interval calculations
Sample-size planning
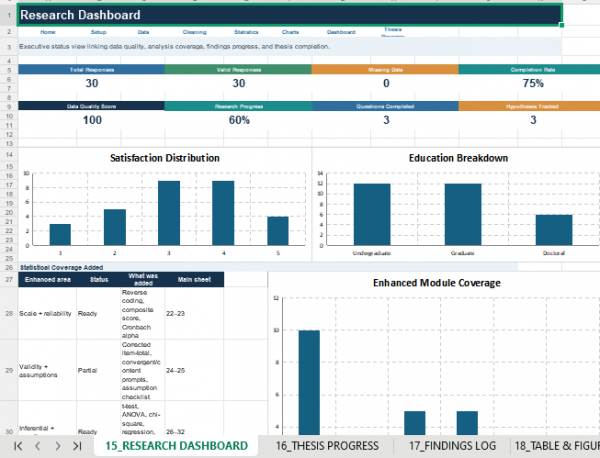
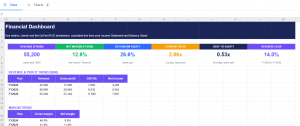
Research charts and dashboard-style visual summaries
Findings and Chapter 4 reporting support
The exact analysis you use should match your research design, variables, hypotheses, and methodology.
Why This Is Different From a Basic Spreadsheet
A basic spreadsheet may give you cells for entering information. This package is organized as a broader academic research data analysis workbook, combining data organization, analysis, calculations, and visual reporting in one research workflow.
The goal is to reduce repetitive spreadsheet setup and make your analysis process easier to follow.
You can enter your research responses, work through the relevant analysis sections, review formula-driven outputs, and use the resulting tables and charts as a starting point for your own thesis interpretation and reporting.
Excel + Google Sheets Ready
The package includes an Excel version together with a Google Sheets-ready workbook.
This gives you the flexibility to work primarily in Microsoft Excel or import the compatible workbook into Google Sheets, depending on your preferred research workflow.
Who Is This For?
This thesis analysis toolkit can be useful for:
Bachelor’s and undergraduate research projects
Master’s and MPhil thesis data analysis
Master’s thesis research
Academic survey and questionnaire projects
Quantitative research projects
Researchers working with structured questionnaire data
Students preparing statistical results for their thesis or dissertation
What Makes the Package Useful
Instead of collecting several unrelated spreadsheets for different tasks, the package is organized as a complete thesis data analysis Excel package covering multiple stages of the research-data workflow.
It can help you keep your research data, analysis calculations, statistical outputs, and visual summaries organized in a single workbook environment.
Important Note
This is a research-analysis tool and template package, not a substitute for statistical methodology or academic supervision. Select statistical procedures according to your study design and explain your findings using your own research context.
WHAT YOU RECEIVE
The paid package is designed around the complete thesis-analysis workflow and includes:
Excel PRO Workbook
A comprehensive thesis research and data-analysis workbook with multiple analysis modules.
Google Sheets-Ready Workbook
A compatible version prepared for use with Google Sheets.
Research & Analysis Documentation
Supporting documentation explaining the workbook structure and workflow.
Statistical Analysis Modules
Multiple analysis sections for descriptive, relational, comparative, reliability, and other quantitative procedures.
Charts & Visual Analysis
Charts and dashboard-style visual summaries connected to the workbook’s analysis workflow.
Chapter 4 Support
A structured results-reporting workflow to help organize statistical findings before writing the final thesis chapter.
QUICK PRODUCT POSITIONING
One research workbook. Multiple analysis workflows. Clearer organization from data entry to results.
This product is built for researchers who want a ready-to-use thesis data analysis workbook instead of building their research spreadsheet from scratch.
FAQ
What is a thesis data analysis Excel template?
It is a structured Excel workbook designed to help organize research data and perform commonly used analysis workflows for thesis or academic research.
Can I use this for questionnaire or survey data?
Yes. The workbook is designed to support structured questionnaire and survey-data workflows, including frequencies, Likert-scale analysis, cross-tabulation, correlations, reliability analysis, and other quantitative procedures included in the package.
Does the workbook include formulas?
Yes. The analysis sections are designed around formula-driven spreadsheet calculations where appropriate rather than relying only on manually typed results.
Does it include charts?
Yes. The package includes research charts and dashboard-style visual summaries connected to the analysis workflow.
Can I use it with Google Sheets?
A Google Sheets-ready version is included so the workbook can be imported and used in Google Sheets, subject to Google Sheets’ compatibility with individual Excel features and formulas.
Is this suitable for an MPhil or master’s thesis?
The workbook can be used for MPhil and master’s research workflows where its included analysis methods match the study design.
Does it write my entire thesis automatically?
No. It is an analysis and research-organization toolkit. It helps organize data, calculations, analysis outputs, and reporting preparation; the researcher remains responsible for methodology, interpretation, and final academic writing.
Can I use the results directly in my thesis?
The outputs can be used as working material for your thesis tables, charts, and analysis. You should review the calculations, confirm that the selected test is appropriate for your methodology, and interpret the results in your own research context.
1 review for Thesis Data Analysis Excel Template | Research Toolkit | Free Sample Download | Complete Pack
James Wilson –
🟢 ✓ Verified Purchase
James Wilson
“I normally end up with several Excel files during a research project. Having the data, analysis, charts and progress tracking together makes the whole process much cleaner.”


James Wilson –
🟢 ✓ Verified Purchase
James Wilson
“I normally end up with several Excel files during a research project. Having the data, analysis, charts and progress tracking together makes the whole process much cleaner.”