Try our free AI tools – no sign-up needed!

Data Analysis Calculator: Free Online Tools
Orixiva · Data & Productivity
Choose the Right Data and Productivity Calculator
Use this collection of browser-based tools to understand number sets, compare percentage changes, calculate weighted scores, explore probability, count possible arrangements, generate random values, and review CSV data. Enter your own values, run a calculation, and read the explanation shown with the result.
- 8 focused calculators
- Step-by-step working
- Copy, download or print results
- Browser-based calculations

Which Calculator Should You Use?
Start with the question you need to answer. The table and cards below help you choose a suitable tool without learning every formula first.
Descriptive Statistics
Summarise a list of numbers with an average, median, mode, quartiles, spread, standard deviation, possible outliers and a histogram.
Read how statistics workPercentage Change
Measure an increase or decrease, apply a percentage, reverse a percentage change, or compare two values.
Read about percentage calculationsWeighted Average
Combine values when some items count more than others, or estimate the score needed to reach a target average.
Read the weighted average guideZ-Score
Compare a value with a mean and standard deviation, convert values and z-scores, or estimate normal-distribution probabilities.
Understand z-scoresProbability
Calculate simple probability, combine independent events, use Bayes’ rule, or find binomial probabilities.
Explore probability examplesCombinations & Permutations
Count selections when order does or does not matter, with optional repetition, and calculate factorials.
Compare combinations and permutationsRandom Number Generator
Generate random integers or decimals, choose items from a list, or roll virtual dice with a modifier.
See random generator optionsCSV Quick Analyzer
Paste or load a CSV-style table to review numeric columns, missing values, duplicate rows and correlation for the first two numeric columns.
Learn how CSV analysis worksHow to Use the Tools
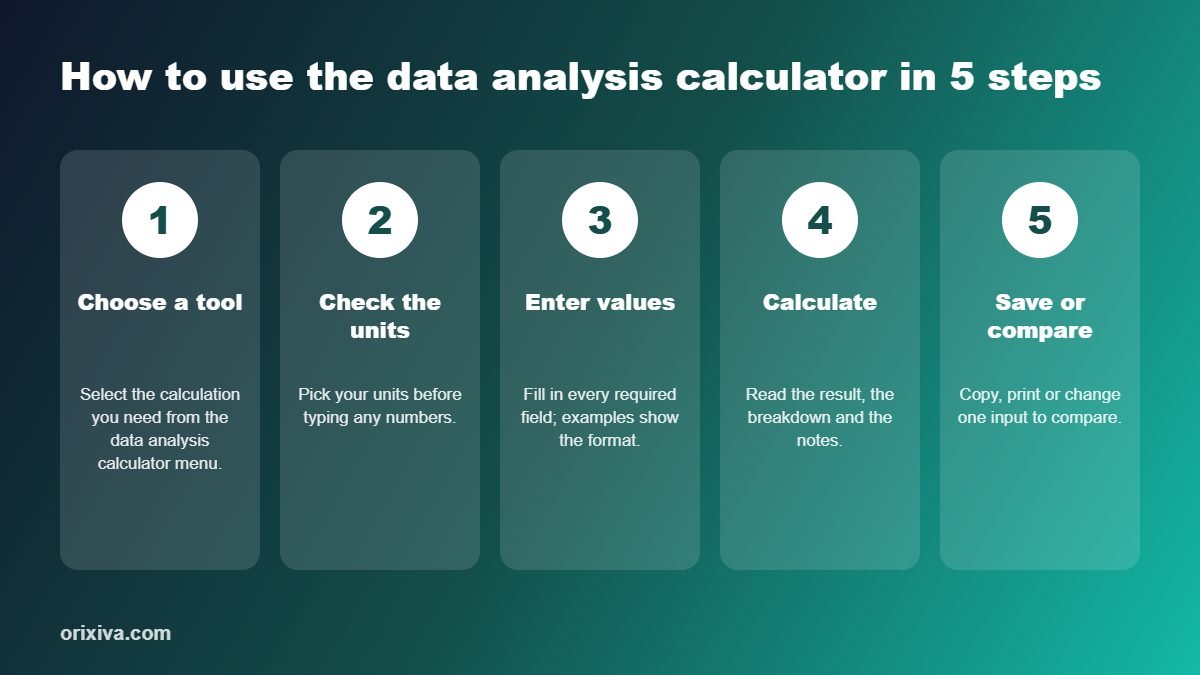
Most tools follow the same simple process. Some calculators show extra fields when you select a different calculation mode.
- Step 1Choose a tool
Select a calculator from the list or search by name.
- Step 2Enter values
Use the labels and help notes beside the input fields.
- Step 3Calculate
Choose the correct mode, then run the calculation.
- Step 4Review steps
Check the result, details, assumptions and formula steps.
- Step 5Keep your result
Copy, download or print it; export recent history when needed.
Helpful tip: Use the display-precision menu to choose 2, 4, 6, 8, 10 or 12 decimal places for supported numeric results. Precision changes how numbers are displayed; it does not make uncertain input data more accurate.
What can you do with a result?
- Copy result: copy a summary to use in a document or message.
- Download TXT: save the current result and calculation notes as a text file.
- Print: print or use your browser’s print-to-PDF option.
- Export CSV: download the recent-calculation list as a CSV file.
- Reset: clear the current form and return to its default inputs.
- Search: filter the calculator list by its name or description.
Recent calculation history is held in page memory while the page remains loaded. Export it before leaving or refreshing the page if you need to keep a copy.
1. Descriptive Statistics Calculator
Descriptive statistics help you understand the main features of a list of numbers. Use this calculator for class results, measurements, survey figures, sales totals or other numeric data that you want to summarise.
What it calculates
- Mean, median and mode
- Count, sum, minimum, maximum and range
- First and third quartiles, plus the interquartile range (IQR)
- Population and sample variance and standard deviation
- Standard error of the mean and coefficient of variation
- Skewness, excess kurtosis and geometric mean when valid
- Potential outliers using the 1.5 × IQR rule
- A histogram and an optional custom percentile
How to use it
- Enter numbers separated by commas, spaces or new lines.
- Optionally enter a percentile from 0 to 100.
- Calculate, then review the summary, histogram and working steps.
Main formulas
Mean = sum of all values ÷ number of values Range = maximum − minimum IQR = third quartile (Q3) − first quartile (Q1)The calculator uses linear interpolation for quartiles. It flags possible outliers below Q1 − 1.5 × IQR or above Q3 + 1.5 × IQR.
Worked example
Input values: 12, 18, 18, 23, 29, 35, 41.
| Measure | Example result | Plain-English meaning |
|---|---|---|
| Mean | 25.142857… | The total divided by 7 values. |
| Median | 23 | The middle value after sorting. |
| Mode | 18 | The value that appears most often. |
| Range | 29 | 41 minus 12. |
| Q1 / Q3 | 18 / 32 | Quartiles calculated with linear interpolation. |
| IQR | 14 | 32 minus 18. |
Check before you interpret: population and sample standard deviation use different denominators. A sample standard deviation needs at least two values. The geometric mean is only shown when every value is greater than zero. A flagged outlier is a signal to review a value, not proof that it is wrong.
2. Percentage Change Calculator
Use Percentage Change to measure movement from an old value to a new one, increase or decrease a starting value by a percentage, work backward to an original value, or compare two values when neither is the original.
Choose the right calculation
| Your question | Use this mode | Method |
|---|---|---|
| How much did a value change? | Percentage change | (New − Original) ÷ |Original| × 100 |
| What is a value after a 15% increase? | Increase / decrease | Starting value × (1 ± percentage ÷ 100) |
| What was the value before a percentage change? | Reverse percentage | Final value ÷ change multiplier |
| How far apart are two values in percentage terms? | Percentage difference | |A − B| ÷ average of |A| and |B| × 100 |
Example: a value increases from 100 to 135
Percentage change = (135 − 100) ÷ |100| × 100 = 35%The change is an increase of 35%. For an applied percentage, 200 decreased by 15% becomes 170. If 230 is the result after a 15% increase, the original value is 230 ÷ 1.15 = 200.
Old and new values→Percentage change→Increase or decrease→Reverse or compare if needed
Important limits: Percentage change is undefined when the original value is zero, so the calculator rejects that case. Reversing a 100% decrease is not possible because the multiplier is zero. When the original value is negative, the tool divides by the absolute value of the original and explains that convention in the result.
If you enter the optional number of periods in percentage-change mode, the calculator also estimates a compounded rate per period when the old and new values are both positive.
3. Weighted Average Calculator
A weighted average gives each value a level of importance called a weight. It is useful when assessment parts, survey responses, products or other items do not count equally.
How to use it
- Enter the values and the matching weights in the same order.
- Choose raw weights or percentage weights. In percentage mode, the weights must total 100.
- Calculate to see the weighted average, each weight’s share and contribution, plus weighted variance and standard deviation.
Worked example: weighted scores
Suppose scores are 80, 90 and 75, with weights 2, 3 and 1.
| Score | Weight | Score × weight |
|---|---|---|
| 80 | 2 | 160 |
| 90 | 3 | 270 |
| 75 | 1 | 75 |
| Total | 6 | 505 |
Find the score needed to reach a target
Choose the target-score mode, provide the target average and the remaining item’s weight. The calculator estimates the value needed on that remaining item, based on the values and weights already entered.
Needed score = (target × total final weight − current weighted total) ÷ remaining weightWeights cannot be negative, the number of values must match the number of weights, and the remaining weight must be greater than zero. The result may be higher than the maximum score allowed in your real grading system, so compare it with your actual rules.
4. Z-Score Calculator
A z-score shows how many standard deviations a value is above or below a mean. A positive z-score is above the mean; a negative z-score is below it. This calculator also converts between values and z-scores and estimates probabilities under a normal-distribution model.
Available modes
- Z-score from a value: enter an observed value, mean and standard deviation.
- Value from a z-score: calculate the value that corresponds to a z-score.
- Z-score from a percentile: convert a percentile between 0 and 100 (excluding the endpoints) into a z-score.
- Probability between two values: enter lower and upper values and the distribution’s mean and standard deviation.
Worked example
For a value of 85, a mean of 75 and a standard deviation of 8:
z = (85 − 75) ÷ 8 = 1.25Under a normal distribution, a z-score of 1.25 is about the 89.44th percentile. This means approximately 89.44% of the modelled distribution lies below that value. It is a model-based probability, not a promise about real-world data.
Assumptions: Standard deviation must be greater than zero. Percentiles and probability estimates use the normal distribution. If your data are strongly skewed, have unusual outliers, or do not fit a normal model, interpret these probabilities carefully.
5. Probability Calculator
Probability describes how likely an event is. The tool includes simple probability, several independent events, Bayes’ rule and binomial probability. Each mode answers a different question, so choose the one that matches your assumptions.
Four modes in plain English
Basic probability
Enter the number of favourable outcomes and the total outcomes.
P(event) = favourable outcomes ÷ total outcomesExample: 3 favourable outcomes out of 8 gives 3 ÷ 8 = 37.5%.
Several independent events
Enter each event’s probability as a percentage. This mode assumes the events are independent.
P(at least one) = 1 − P(none)For independent events, multiply the probability that each one does not happen to find P(none).
Bayes’ rule
Enter the prior probability of A, P(B given A), and P(B given not A). The calculator estimates the updated probability of A after observing B.
P(A|B) = P(A) × P(B|A) ÷ P(B)Binomial probability
Use this for a fixed number of trials where each trial has the same success probability, under the binomial model.
P(X = k) = C(n,k) × p^k × (1 − p)^(n − k)The result includes exact-k and cumulative probabilities, plus the distribution’s mean, variance and standard deviation.
How to avoid a misleading probability result
- Check that probabilities are entered as percentages from 0 to 100.
- Use the independent-events mode only if independence is a reasonable assumption.
- For Bayes’ rule, use conditional probabilities that match the event definitions.
- For binomial probability, make sure the trial count and success count match your real question.
The independent-events mode accepts up to 200 event probabilities. The binomial mode accepts a trial count from 1 to 100,000, with the number of successes from 0 to the trial count.
6. Combinations and Permutations Calculator
Combinations and permutations both count possible selections, but they treat order differently. Ask yourself one question first: does changing the order create a different result?
| Type | Does order matter? | Formula | Example use |
|---|---|---|---|
| Combination (nCr) | No | n! ÷ [r! × (n − r)!] | Selecting a group of 3 people. |
| Permutation (nPr) | Yes | n! ÷ (n − r)! | Assigning first, second and third place. |
| Ordered with repetition | Yes, repeats allowed | n^r | Creating a sequence where items can repeat. |
| Unordered with repetition | No, repeats allowed | C(n + r − 1, r) | Selecting repeated items when order is ignored. |
Worked example: choose 3 items from 10
10C3 = 10! ÷ (3! × 7!) = 120 combinations 10P3 = 10! ÷ 7! = 720 permutationsThere are 120 groups of three if order does not matter, but 720 ordered arrangements if order matters. The calculator also shows factorials, repetition-based counts and the “1 in N” size for a possible exact selection.
Large numbers: the tool calculates combinatoric values with exact integer arithmetic. Very long values may be shortened in the display to make them easier to read. Inputs n and r must be whole numbers from 0 to 5,000.
7. Random Number Generator
Use the random generator to draw numbers, select names or items from a list, or roll virtual dice. The current tool uses the browser’s cryptographic random-number function when it is supported by the browser.
What you can generate
- Random integers: choose a minimum and maximum, set how many to generate, and optionally avoid repeated numbers.
- Random decimals: select a range, number of results and 0–10 decimal places.
- Random list picks: paste one item per line and choose whether picks must be unique.
- Dice rolls: choose the number of dice, the number of sides per die, and an optional positive or negative modifier.
Choose a mode→Set range or items→Set count or dice→Generate
Useful controls and limits
- Integer and decimal modes can generate between 1 and 10,000 results at a time.
- Integer mode can avoid repeats and optionally sort results in ascending or descending order.
- List mode accepts up to 5,000 non-empty lines. Unique picks cannot exceed the number of available items.
- Dice mode accepts 1–100 dice and 2–1,000 sides per die.
Use responsibly: browser-based secure random generation is a technical feature, not a guarantee that a drawing, contest, regulated game or audit meets every legal or independent fairness requirement. Check the rules that apply to your use case.
8. CSV Quick Analyzer
CSV Quick Analyzer gives you a quick summary of tabular text without requiring spreadsheet software. Paste data or load a CSV, TSV or TXT file, choose whether the first row is a header, and review the detected column types and quality checks.
How to use it
- Paste your delimited data into the input box, or choose a supported local file.
- Set the header option to automatic detection, yes or no.
- Keep automatic delimiter detection or choose comma, semicolon, tab or pipe.
- Calculate, then review the row and column counts, column summary, missing or invalid values, duplicates and available correlation.
What the report includes
- Numeric columns: valid count, missing or invalid count, sum, mean, median, minimum, maximum and sample standard deviation where possible.
- Text columns: valid count, missing count, unique-value count and the most frequent value.
- Data quality: the number of exact duplicate rows and empty or invalid cells.
- Correlation: a correlation estimate for the first two detected numeric columns, using rows with values in both columns.
Paste or load data→Detect rows and columns→Identify column types→Review summary
Privacy and limits: the uploaded calculator code processes CSV data in the browser and states that data is not uploaded. The file picker accepts CSV, TSV and TXT files up to 2 MB. Analysis is limited to 50,000 rows and 60 columns. Pasted content has a 2 MB-equivalent character limit in the code.
Automatic detection is helpful, but it is not perfect for every file. Check the delimiter and header settings when columns appear in the wrong place. A column is treated as numeric when at least 80% of its non-empty cells look numeric. Correlation is available only when there are at least two numeric columns with enough paired data, and this version calculates it for the first two numeric columns only.
Common Mistakes and Quick Checks
| Tool | Common issue | What to check |
|---|---|---|
| Statistics | Mixing sample and population values. | Choose the statistic that matches your data and question. |
| Percentage change | Using zero as the original value. | Percentage change from a zero baseline is undefined. |
| Weighted average | Entering a different number of values and weights. | Use one weight for each value; percentage weights must total 100. |
| Z-score | Using a zero or negative standard deviation. | Enter a positive standard deviation and consider whether normality is reasonable. |
| Probability | Assuming related events are independent. | Check the assumptions before multiplying probabilities. |
| Combinations | Confusing groups with ordered outcomes. | Ask whether a different order creates a different outcome. |
| Random generator | Requesting more unique picks than available values or names. | Increase the available pool or reduce the number of unique picks. |
| CSV analyzer | Wrong delimiter, header or mixed data types. | Check import settings and review missing/invalid cell counts. |
Frequently Asked Questions
These are editorial help questions written for this page. They are not presented as comments or questions submitted by real users.
Is the Orixiva Data & Productivity tool free to use?
The supplied tool interface presents its calculators as browser-based tools. No payment step is shown in the uploaded code. Check the live page for the current access policy.
Does the calculator upload my data?
The uploaded JavaScript performs calculations in the browser. The CSV analyzer reads a selected file locally and the interface states that nothing is uploaded. This description is based on the supplied code, so keep it accurate if the tool’s code or hosting behavior changes.
Can I copy or download a result?
Yes. A calculated result can be copied, downloaded as a text file, or printed. You can also export the recent-calculation history as a CSV file.
Will my recent calculations still be there after I refresh?
The code keeps recent history in a page variable rather than saving it permanently. Export the history before refreshing or leaving the page if you need a separate copy.
Can I choose how many decimal places to display?
Yes. The display menu offers 2, 4, 6, 8, 10 or 12 decimal places. Some exact integer results or text summaries follow their own display rules.
How many values can the Descriptive Statistics Calculator handle?
The input accepts up to 100,000 numeric values separated by commas, spaces or new lines. Very large lists may still take longer to process on an older device.
What is the difference between mean, median and mode?
The mean is the total divided by the number of values. The median is the middle value after sorting. The mode is the most frequent value, if one or more values repeat more than others.
How does the statistics tool identify possible outliers?
It uses the 1.5 × IQR rule. Values below Q1 − 1.5 × IQR or above Q3 + 1.5 × IQR are flagged for review; a flag does not prove that a value is an error.
Why does the geometric mean sometimes not appear?
The tool shows a geometric mean only when all values are greater than zero. If the data include zero or negative values, that result is not shown.
How do I calculate a percentage increase?
Use the original and new values in Percentage Change mode. The percentage change is (new value − original value) ÷ the absolute original value × 100. For example, a change from 100 to 135 is a 35% increase.
Why can’t I calculate percentage change from zero?
The original value is the baseline in the denominator. Dividing by zero is undefined, so the calculator asks for a non-zero original value instead.
Can I find the original price before a discount or increase?
Yes. Choose the reverse-percentage mode and enter the final value, percentage and increase/decrease direction. A 100% decrease cannot be reversed because it reduces the value to zero.
Do percentage weights have to total 100 in Weighted Average?
Yes. When percentage-weight mode is selected, the entered weights must total 100. With raw-number weights, the weights may use another scale, but none can be negative and the total weight must be greater than zero.
Can the Weighted Average tool estimate a score needed for a target?
Yes. Select the target-score mode, enter the target average and remaining weight, and keep one value paired with each existing weight. Compare the result with the highest score allowed in your real system.
What does a z-score of 1.25 mean?
It means the value is 1.25 standard deviations above the mean. Under a normal-distribution model, it is approximately the 89.44th percentile.
Does the Z-Score Calculator assume a normal distribution?
Its percentile and probability calculations use the normal distribution. Real data that do not follow that model may have different probabilities, even when the z-score itself is calculated correctly.
What is the difference between probability and odds?
Probability compares favourable outcomes with all possible outcomes. Odds compare favourable outcomes with unfavourable outcomes. The calculator reports probability and related odds for basic integer counts.
When should I use Bayes’ rule?
Use the Bayes mode when you know a prior probability and the conditional probabilities of an observation with and without the event. The result estimates the event’s probability after observing that evidence.
What is the difference between a combination and a permutation?
A combination treats the selected group as the same regardless of order. A permutation treats a change in order as a different arrangement. Choose the formula based on what counts as a different outcome in your question.
Are large combination and permutation results rounded?
The calculator uses exact integer arithmetic for these counts. Very long values may be shortened in the on-screen display for readability.
Can the random generator make unique picks?
Yes. Integer mode and list mode include a unique/no-repeat option. The number of unique picks cannot exceed the number of available integer values or list items.
What happens if my browser does not support the secure random generator?
The code checks for the browser’s secure random-number function. If that function is not available, it displays an error instead of generating results with a weaker fallback.
What CSV file types and sizes are supported?
The file picker accepts CSV, TSV and TXT files up to 2 MB. The analyzer supports up to 50,000 rows and 60 columns. You can also paste delimited text into the input field.
Can CSV Quick Analyzer detect missing values and duplicates?
Yes. It counts empty or invalid cells and exact duplicate data rows. Review the header and delimiter settings if the imported table does not look correct.
How does CSV Quick Analyzer decide whether a column is numeric?
It treats a column as numeric when at least 80% of its non-empty cells look like numbers. Mixed columns may therefore be classified differently than you expect, so check the reported type and invalid-cell count.
Which columns are used for the CSV correlation value?
This version calculates correlation for the first two detected numeric columns, using rows that contain a numeric value in both columns. It does not calculate every possible pair of numeric columns.
Help Make These Tools Clearer
Was a formula difficult to understand, or did you notice an input that could be explained better? Share what was unclear and what would help you complete your task.
Suggested feedback prompt: “Was this calculator helpful? Tell us what could be clearer.”
This is a proposed user-feedback prompt, not a working submission form. Enable and configure WordPress comments or a form before asking visitors to submit feedback. Add spam controls, moderation and a privacy notice as needed. Do not display fake reviews or imply that feedback has already been received.