Try our free AI tools – no sign-up needed!

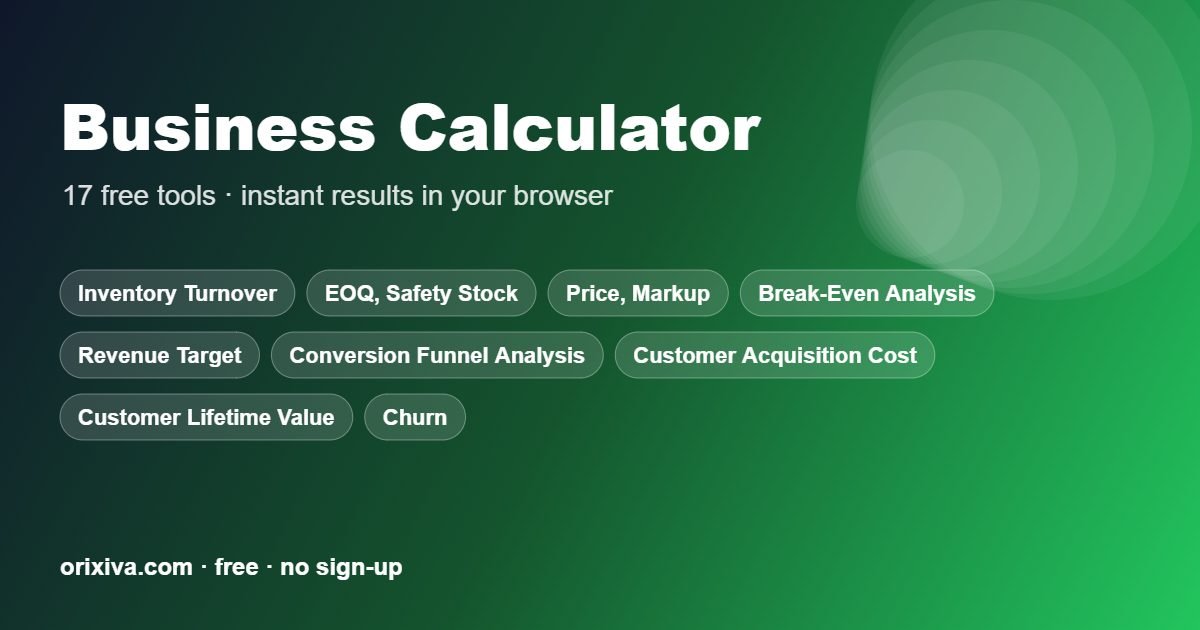
Quick answer: To use the business calculator, pick one of the 17 tools in the menu above, enter your values with the right units and press Calculate. The result appears with notes, and you can copy or print it.
- 17calculators
- 0sign-ups needed
- 100%in your browser
- Freeforever
What the business calculator includes
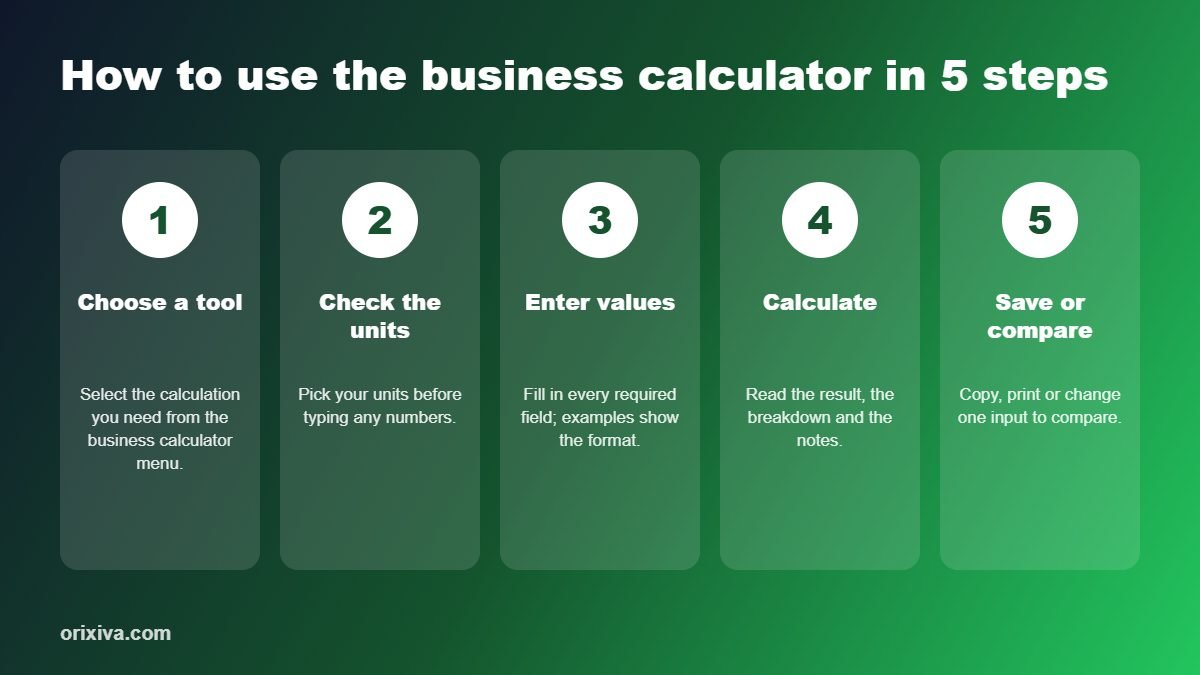
The business calculator contains 17 separate tools. Choose one from the menu at the top of the page; each tool keeps its own inputs and explains the formula it uses.
| Calculator | What it does |
|---|---|
| Inventory Turnover & Days | Turnover ratio, days inventory outstanding, sell-through and carrying cost. |
| EOQ, Safety Stock & Reorder Point | Economic order quantity, service-level safety stock, reorder point and annual cost. |
| Price, Markup & Margin | Set a price from cost and target margin or markup, with discounts, tax and fees. |
| Break-Even Analysis | Break-even units and sales, margin of safety, target profit and a cost–volume chart. |
| Revenue Target & Sales Funnel | Work back from a revenue goal to orders, leads and visitors needed. |
| Conversion Funnel Analysis | Step-by-step conversion rates, drop-off and overall conversion for any funnel. |
| Customer Acquisition Cost & Payback | Blended CAC, CAC payback months and LTV:CAC ratio. |
| Customer Lifetime Value | LTV from ARPU, margin and churn, with optional discount rate and retention curve. |
| Churn & Retention Rate | Customer churn, retention, net growth and revenue churn (NRR). |
| MRR / ARR Growth Projection | Project recurring revenue with new sales, growth and churn month by month. |
| Cash Runway & Burn Rate | Months of runway from cash, revenue growth and expenses, with zero-cash date. |
| Working Capital & Liquidity Ratios | Working capital, current, quick and cash ratios plus cash conversion cycle. |
| True Employee Cost | Fully loaded cost of an employee per year, month and productive hour. |
| Capacity Utilization & Staffing | Utilization, required capacity and staff needed for a workload. |
| PERT Project Estimate & Buffer | Three-point estimate per task, project duration, risk buffer and on-time probability. |
| Price Elasticity of Demand | Midpoint elasticity, revenue impact and the revenue-maximising direction. |
| Discount Impact on Profit | Extra sales needed to keep the same profit after a price cut. |
How to use the business calculator
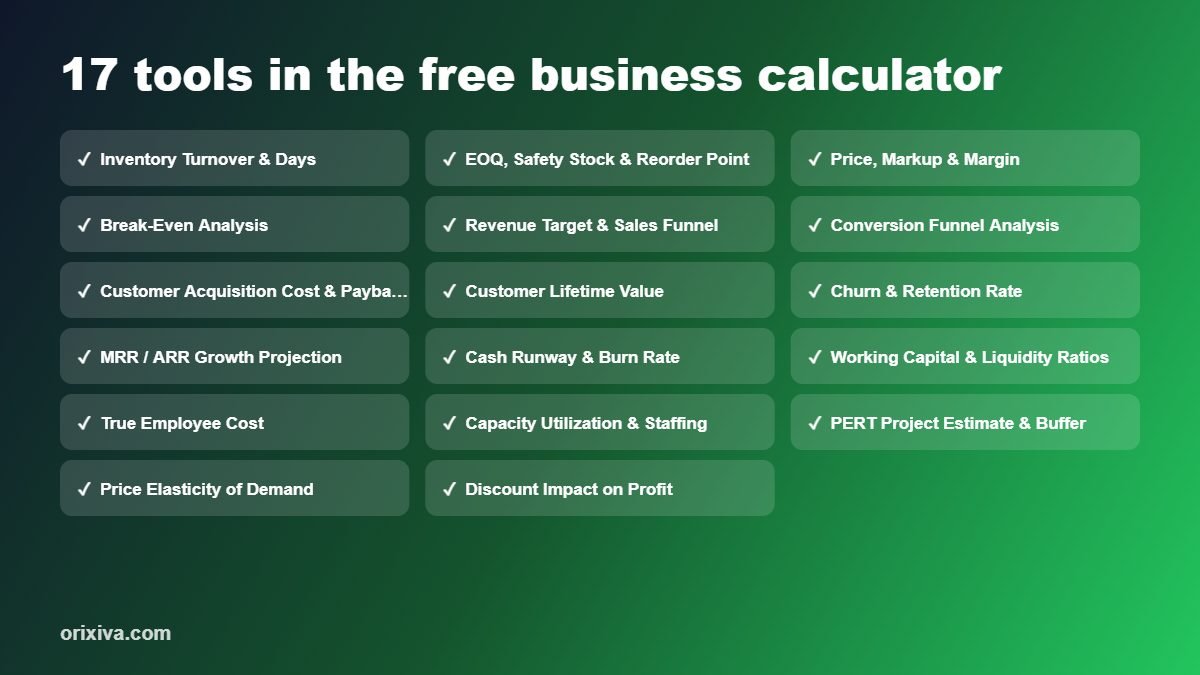
- Choose a tool. Select the calculation you need from the business calculator menu.
- Check the units. Pick the units you are working in before typing numbers, so the formula uses the right values.
- Enter your values. Fill in every required field. Example values show the expected format.
- Calculate and review. Read the main result, the breakdown and any notes or charts under it.
- Save or compare. Copy, print or download the result, or change one input to compare scenarios.
Who uses this business calculator?
- Small business owners setting prices and checking break-even.
- E-commerce sellers managing stock, reorder points and discounts.
- SaaS founders tracking MRR, churn, CAC and LTV.
- Finance teams checking runway and working capital.
- Operations managers planning staff capacity and projects.
Tips for accurate results with the business calculator
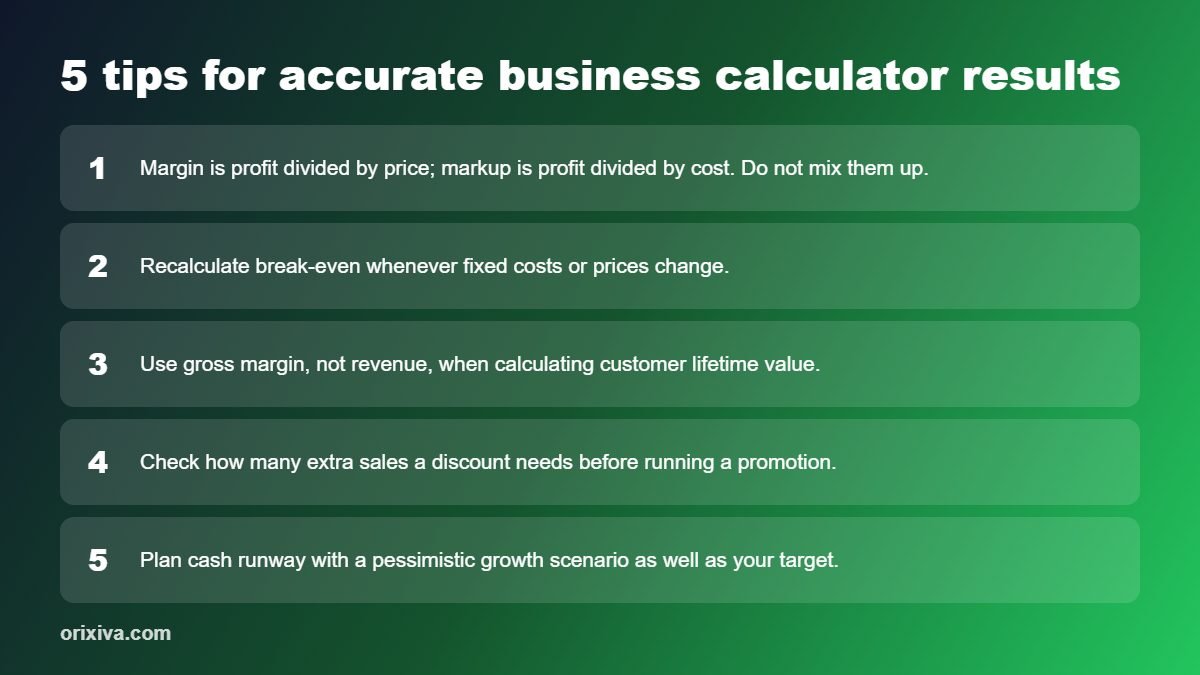
- Margin is profit divided by price; markup is profit divided by cost. Do not mix them up.
- Recalculate break-even whenever fixed costs or prices change.
- Use gross margin, not revenue, when calculating customer lifetime value.
- Check how many extra sales a discount needs before running a promotion.
- Plan cash runway with a pessimistic growth scenario as well as your target.
Business calculator guide: key formulas and worked examples
The business calculator brings together the numbers that owners, managers and finance teams check every month. This guide lists the formulas behind each tool, explains the benchmarks people use to judge them and walks through worked examples for a small online shop and a subscription business.
Formulas at a glance
| Metric | Formula |
|---|---|
| Gross margin | (Price − Cost) ÷ Price |
| Markup | (Price − Cost) ÷ Cost |
| Break-even units | Fixed costs ÷ (Price − Variable cost per unit) |
| Inventory turnover | Cost of goods sold ÷ Average inventory |
| Days inventory outstanding | 365 ÷ Inventory turnover |
| EOQ | √(2 × Annual demand × Order cost ÷ Holding cost per unit) |
| Reorder point | Daily demand × Lead time + Safety stock |
| Customer lifetime value | ARPU × Gross margin ÷ Monthly churn |
| CAC payback | CAC ÷ (ARPU × Gross margin) |
| Cash runway | Cash ÷ Net monthly burn |
| Current ratio | Current assets ÷ Current liabilities |
Margin and markup are not the same
A product that costs 60 and sells for 100 has a 40% margin but a 67% markup. Mixing the two is one of the most common pricing mistakes. If you want a 40% margin and add 40% to cost, you charge 84 and end up with only a 28.6% margin. The price, markup and margin tool always shows both figures side by side.
Worked example 1: break-even point
A small bakery has fixed costs of 6,000 a month for rent, wages and equipment. Each cake sells for 25 and costs 10 in ingredients and packaging, leaving a contribution margin of 15. Break-even is 6,000 ÷ 15 = 400 cakes a month, or 10,000 in sales. Selling 500 cakes gives a profit of 100 × 15 = 1,500 and a margin of safety of 20%, the share by which sales could fall before the bakery makes a loss. The break even calculator also draws this on a cost–volume chart so you can see where the lines cross.
Worked example 2: inventory turnover and EOQ
A shop with 120,000 of cost of goods sold a year and average stock of 20,000 turns its inventory 6 times a year, so each item sits on the shelf for about 61 days. For a product with annual demand of 2,400 units, an order cost of 50 and a holding cost of 2 per unit per year, EOQ = √(2 × 2,400 × 50 ÷ 2) ≈ 346 units. Ordering that amount about seven times a year keeps ordering and holding costs at their combined lowest.
With daily demand of about 6.6 units and a supplier lead time of 10 days, the reorder point is 66 units plus safety stock. At a 95% service level and a daily demand standard deviation of 2 units, safety stock is about 1.65 × 2 × √10 ≈ 10 units, so you reorder when stock falls to 76.
Worked example 3: subscription metrics
A software company charges 40 a month with an 80% gross margin and loses 3% of its customers each month. Customer lifetime value is 40 × 0.80 ÷ 0.03 ≈ 1,067. If it costs 400 in marketing and sales to win a customer, the LTV to CAC ratio is about 2.7 and the CAC payback period is 400 ÷ 32 = 12.5 months. Many investors look for an LTV to CAC ratio of 3 or more and payback within 12 months, so this business should either lower acquisition cost or reduce churn. The customer lifetime value calculator can also apply a discount rate for a more cautious figure.
Worked example 4: revenue target and funnel
To reach 50,000 in monthly revenue with an average order of 80, you need 625 orders. If 2.5% of visitors buy, you need 25,000 visitors a month. Raising the conversion rate to 3% cuts that to about 20,800 visitors, which is often cheaper than buying more traffic. The conversion funnel tool shows where people drop off between product page, cart and checkout.
Worked example 5: cash runway
A startup with 300,000 in the bank, 40,000 in monthly expenses and 15,000 in monthly revenue burns 25,000 net each month, which gives 12 months of runway. If revenue grows 5% a month instead, the monthly burn shrinks each month and the company reaches break-even after about 20 months with roughly 21,000 still in the bank. The cash runway calculator lets you add revenue growth to see this effect month by month. Most founders start raising new funding with at least 6 to 9 months of runway left.
Worked example 6: true employee cost
A salary is only part of what an employee costs. On a salary of 50,000, employer taxes, pension contributions, health cover, equipment and software can add 20 to 35%. At 30%, the true annual cost is 65,000, or about 34 an hour over 1,900 working hours. Use this figure, not the salary, when you price services or decide whether to hire or outsource.
Benchmarks to keep in mind
- A current ratio between about 1.2 and 2 usually signals healthy short-term liquidity.
- Monthly churn below 2% is strong for small-business software; consumer apps often run higher.
- Net revenue retention above 100% means existing customers grow faster than you lose them.
- Benchmarks differ by industry, so compare yourself with businesses like yours.
For more on planning and cash flow, the U.S. Small Business Administration guide to startup costs is a useful free resource.
Privacy and accuracy
The business calculator runs entirely in your browser. Numbers you type are not sent to Orixiva or stored on a server.
Results use standard published formulas and are rounded for display. They are estimates for planning, study and everyday decisions; for legal, medical, engineering or financial decisions, confirm them with a qualified professional. For background reading, see the U.S. Small Business Administration.
Related free calculators
Need a different kind of calculation? These pages work the same way as this business calculator.
- Car Calculator for fuel, car loans, EV charging and tyres.
- Computer Calculator for subnets, storage and download time.
- Data Analysis Calculator for z-scores, weighted averages and CSV.
- Everyday Calculator for percentages, tips and GPA.
- Scientific Calculator for equations, triangles and matrices.
- All free calculators in one place.
Share your feedback
Which business calculator tool did you use, and was the result what you expected? Tell other readers in the comments, or suggest a calculator we should add next. Comments are reviewed before they appear.
Frequently asked questions
Is this business calculator free?
Yes. All 17 business tools are free and run in your browser.
What is the difference between markup and margin?
Markup is profit as a percentage of cost; margin is profit as a percentage of the selling price. Price, Markup & Margin calculates both.
How do I calculate break-even?
Enter fixed costs, price per unit and variable cost per unit. The break-even tool shows units, sales and margin of safety with a chart.
How is customer lifetime value calculated?
LTV uses average revenue per user, gross margin and churn rate, with an optional discount rate.
Can it calculate cash runway?
Yes. Cash Runway & Burn Rate shows months of runway and the date cash would reach zero.
Is my business data private?
Yes. Calculations run on your device and nothing is uploaded.
What is inventory turnover and how is it calculated?
Inventory turnover = cost of goods sold / average inventory. The Inventory Turnover & Days tool also shows days inventory outstanding (365 / turnover), sell-through rate and the yearly cost of carrying stock.
What is EOQ and when should I reorder?
Economic order quantity is the order size that minimises ordering plus holding cost: EOQ = square root of (2 x annual demand x order cost / holding cost per unit). The reorder point is daily demand x lead time plus safety stock for your chosen service level.
How do I set a price from a target margin?
Price = cost / (1 - margin). For a 40% margin on a $30 cost the price is $50. Price, Markup & Margin also adds discounts, sales tax and payment fees so you see the final shelf price.
What is margin of safety in break-even analysis?
It is how far sales can fall before you make a loss: (actual sales - break-even sales) / actual sales. The Break-Even tool also finds the units needed for a target profit and draws a cost-volume-profit chart.
How many leads do I need to hit a revenue target?
Revenue Target & Sales Funnel works backwards: revenue / average order value gives orders, orders / close rate gives leads, and leads / visitor conversion gives the traffic you need each month.
How do I find where my funnel loses customers?
Enter the number of people at each step in Conversion Funnel Analysis. It shows the step-to-step conversion, the drop-off at each stage and the overall conversion from first to last step.
What is CAC payback and a good LTV to CAC ratio?
CAC payback is how many months of gross profit it takes to earn back the cost of acquiring a customer. Many subscription businesses aim for an LTV:CAC ratio of about 3:1 and payback within 12 months.
How is churn rate calculated?
Customer churn = customers lost in a period / customers at the start. Churn & Retention Rate also gives retention, net customer growth and net revenue retention (NRR), which includes upgrades and downgrades.
How does the MRR and ARR projection work?
MRR / ARR Growth Projection starts from current monthly recurring revenue and adds new sales and expansion, minus churn, month by month. ARR is MRR x 12.
How is cash runway calculated?
Runway = cash in the bank / net monthly burn. Cash Runway & Burn Rate can also grow revenue and expenses each month and shows the date cash would reach zero.
What do the current and quick ratios tell me?
Current ratio = current assets / current liabilities; quick ratio leaves out inventory. Values above 1 mean short-term debts are covered. The tool also calculates working capital and the cash conversion cycle.
What is the true cost of an employee?
Salary is only part of it. True Employee Cost adds payroll taxes, benefits, equipment and overheads, then divides by productive hours after holidays and leave to give a real cost per hour.
How do I work out how many staff I need?
Capacity Utilization & Staffing divides the total workload hours by the productive hours per person at your target utilization, and rounds up to whole staff.
What is a PERT estimate?
PERT uses three estimates per task: (optimistic + 4 x most likely + pessimistic) / 6. The PERT tool adds the tasks, calculates a risk buffer and the probability of finishing by a deadline.
What does price elasticity of demand mean?
It is the percentage change in quantity sold divided by the percentage change in price, using the midpoint method. If demand is elastic (above 1), a price cut can raise revenue; if inelastic, a price rise usually does.
How many more sales do I need after a discount?
Discount Impact on Profit compares your margin before and after the price cut and shows the extra sales volume needed to earn the same gross profit. Deep discounts on low-margin products often need very large increases.
Can I use my own currency?
Yes. The business tools work with any currency; type amounts in your own currency and read results in the same currency.
Do I need to install anything?
No. The business calculator runs in any modern browser on phone, tablet or computer, with no download or sign-up.
Are the results financial or tax advice?
No. Results are estimates for planning and learning. For tax, legal or investment decisions, confirm with a qualified accountant or adviser.
Ready to calculate? Scroll up to the business calculator, choose a tool and get your answer in seconds.