Try our free AI tools – no sign-up needed!

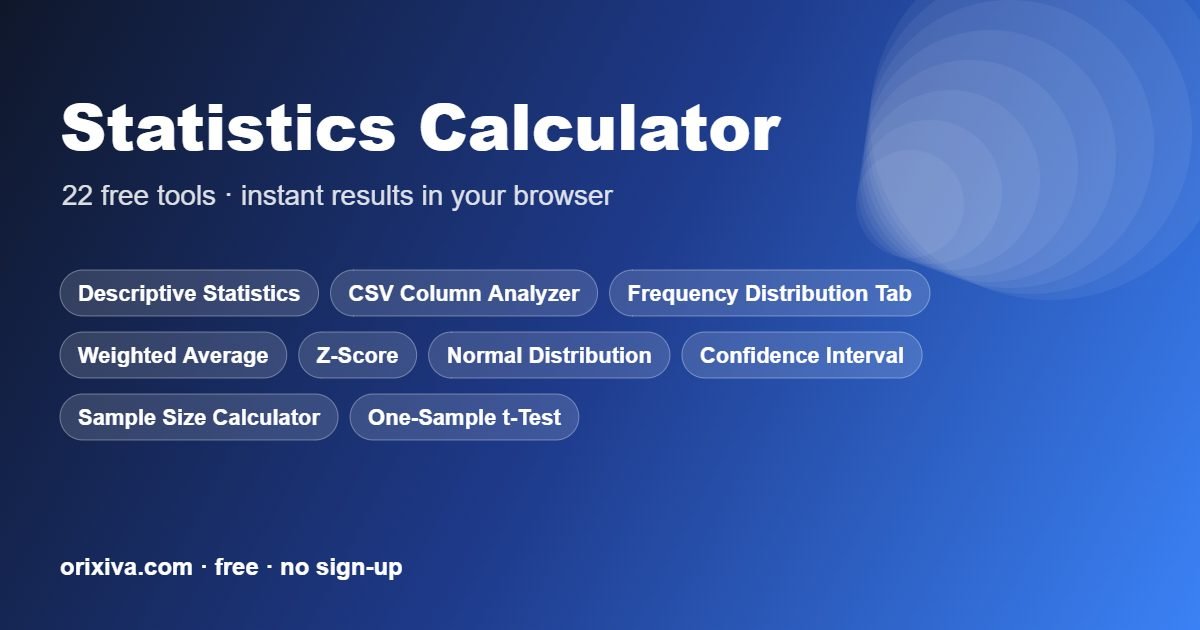
Quick answer: To use the statistics calculator, pick one of the 22 tools in the menu above, enter your values with the right units and press Calculate. The result appears with notes, and you can copy or print it.
- 22calculators
- 0sign-ups needed
- 100%in your browser
- Freeforever
What the statistics calculator includes
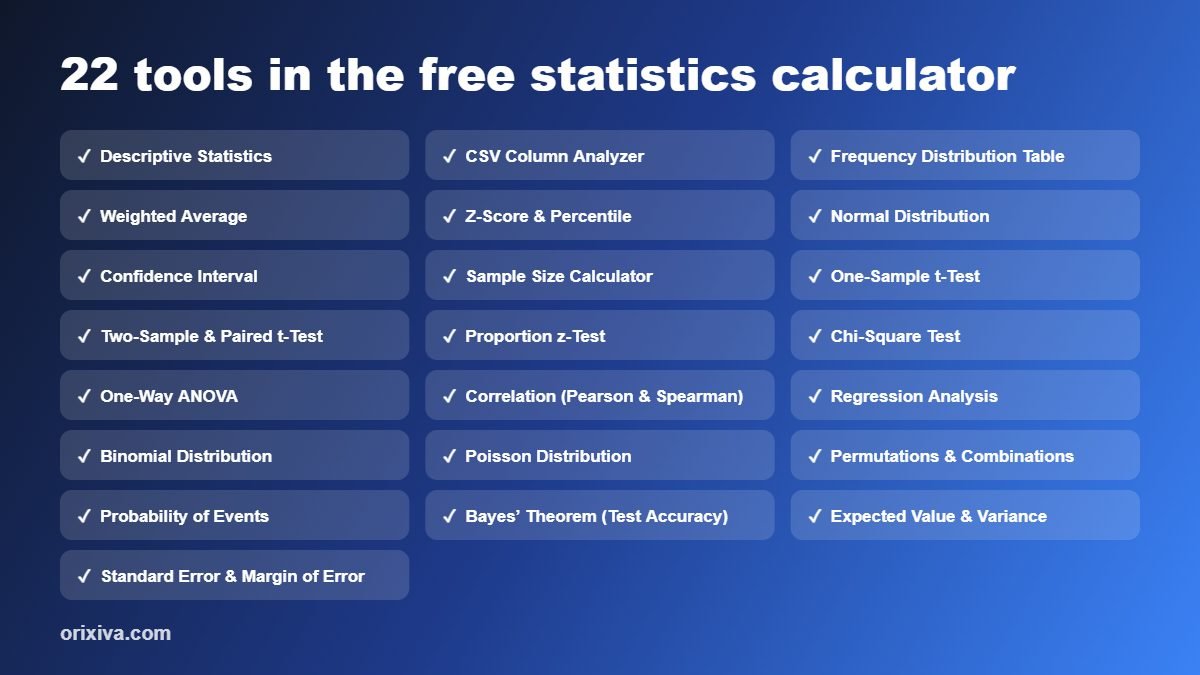
The statistics calculator contains 22 separate tools. Choose one from the menu at the top of the page; each tool keeps its own inputs and explains the formula it uses.
| Calculator | What it does |
|---|---|
| Descriptive Statistics | Mean, median, mode, SD, quartiles, skewness, kurtosis, outliers, histogram and box plot. |
| CSV Column Analyzer | Paste a table with headers; get statistics for every numeric column. |
| Frequency Distribution Table | Grouped classes with frequency, relative and cumulative frequency. |
| Weighted Average | Weighted mean, weighted SD and each item’s contribution. |
| Z-Score & Percentile | Z-score, percentile and tail probabilities for a value or a whole data set. |
| Normal Distribution | Below, above, between and outside probabilities, plus inverse (find x for a percentile). |
| Confidence Interval | Interval for a mean (z or t) or a proportion (Wald and Wilson), from summary or raw data. |
| Sample Size Calculator | Sample size for estimating a mean or proportion, with finite population correction. |
| One-Sample t-Test | Test a mean against a hypothesised value from summary statistics or raw data. |
| Two-Sample & Paired t-Test | Welch, pooled-variance or paired t-test with effect size. |
| Proportion z-Test | One-sample or two-sample test for proportions. |
| Chi-Square Test | Goodness-of-fit or test of independence for a contingency table. |
| One-Way ANOVA | Compare the means of 3 or more groups with an F-test. |
| Correlation (Pearson & Spearman) | r, ρ, r², covariance, significance test and scatter plot. |
| Regression Analysis | Linear, quadratic, exponential, logarithmic and power models with prediction. |
| Binomial Distribution | Exact, cumulative and range probabilities with a distribution chart. |
| Poisson Distribution | Probability of event counts for a known average rate. |
| Permutations & Combinations | Exact nPr, nCr, with and without repetition (big integers). |
| Probability of Events | Union, intersection, conditional and complement for two events. |
| Bayes’ Theorem (Test Accuracy) | Posterior probability, PPV and NPV from prevalence, sensitivity and specificity. |
| Expected Value & Variance | Mean, variance and SD of a discrete probability distribution. |
| Standard Error & Margin of Error | SE of a mean or proportion and the margin at a confidence level. |
How to use the statistics calculator
- Choose a tool. Select the calculation you need from the statistics calculator menu.
- Check the units. Pick the units you are working in before typing numbers, so the formula uses the right values.
- Enter your values. Fill in every required field. Example values show the expected format.
- Calculate and review. Read the main result, the breakdown and any notes or charts under it.
- Save or compare. Copy, print or download the result, or change one input to compare scenarios.

Who uses this statistics calculator?
- Students checking homework and exam practice in statistics courses.
- Researchers and analysts running quick t-tests, chi-square tests and ANOVA.
- Teachers preparing worked examples and answer keys.
- Marketers and product teams analysing survey and A/B test data.
- Quality engineers checking process data and confidence intervals.
Tips for accurate results with the statistics calculator
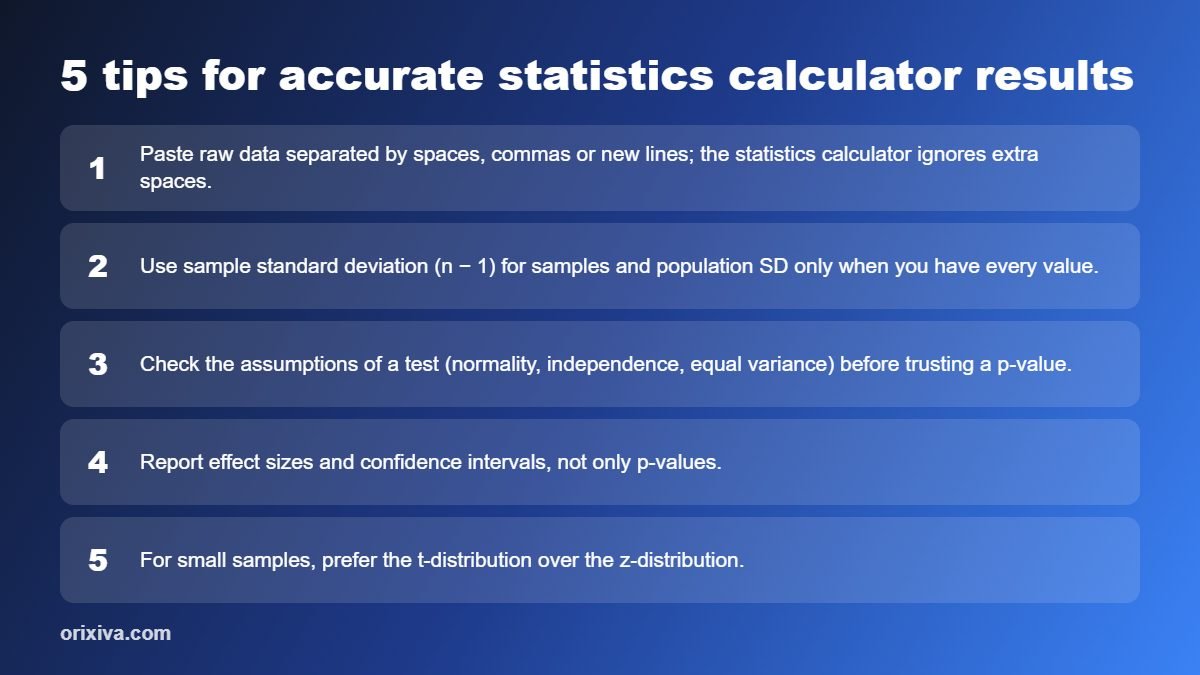
- Paste raw data separated by spaces, commas or new lines; the statistics calculator ignores extra spaces.
- Use sample standard deviation (n − 1) for samples and population SD only when you have every value.
- Check the assumptions of a test (normality, independence, equal variance) before trusting a p-value.
- Report effect sizes and confidence intervals, not only p-values.
- For small samples, prefer the t-distribution over the z-distribution.
Privacy and accuracy
The statistics calculator runs entirely in your browser. Numbers you type are not sent to Orixiva or stored on a server.
Results use standard published formulas and are rounded for display. They are estimates for planning, study and everyday decisions; for legal, medical, engineering or financial decisions, confirm them with a qualified professional. For background reading, see the NIST/SEMATECH e-Handbook of Statistical Methods.
Related free calculators
Need a different kind of calculation? These pages work the same way as this statistics calculator.
- Aviation Fuel Calculator for flight time, fuel burn and nautical units.
- Computer Calculator for subnets, storage and download time.
- Data Analysis Calculator for z-scores, weighted averages and CSV.
- Everyday Calculator for percentages, tips and GPA.
- Scientific Calculator for equations, triangles and matrices.
- All free calculators in one place.
Share your feedback
Which statistics calculator tool did you use, and was the result what you expected? Tell other readers in the comments, or suggest a calculator we should add next. Comments are reviewed before they appear.
Frequently asked questions
Is this statistics calculator free?
Yes. All 22 statistics tools are free, need no sign-up and run in your browser.
Can it calculate standard deviation?
Yes. Descriptive Statistics shows the sample and population standard deviation along with mean, median, quartiles, skewness and kurtosis.
Which hypothesis tests are included?
One-sample, two-sample and paired t-tests, one- and two-proportion z-tests, chi-square goodness-of-fit and independence tests, and one-way ANOVA.
Can I do linear regression?
Yes. The regression tool fits linear, quadratic, exponential, logarithmic and power models and predicts new values.
How do I find a p-value?
Choose the matching test, enter your data or summary statistics and the p-value appears with the test statistic and decision.
Is my data uploaded?
No. All calculations happen in your browser, so your data stays on your device.
How do I calculate standard deviation?
Paste your numbers into Descriptive Statistics. It shows sample and population standard deviation, plus mean, median, mode, quartiles, skewness, kurtosis and outliers with a histogram and box plot.
Can I analyse a whole spreadsheet?
Yes. Paste a table with headers into the CSV Column Analyzer and it calculates statistics for every numeric column at once.
How do I make a frequency distribution table?
Enter raw data and a class width or number of classes. The tool groups the values and shows frequency, relative frequency and cumulative frequency.
How do I calculate a weighted average?
Multiply each value by its weight, add them up and divide by the total weight. The Weighted Average tool also shows each item's contribution and the weighted standard deviation.
What does a z-score mean?
z = (x - mean) / standard deviation. It tells you how many standard deviations a value is from the mean; z = 2 is higher than about 97.7% of a normal distribution.
How do I find a probability under the normal curve?
Enter the mean, standard deviation and value or range in the Normal Distribution tool. It gives the probability below, above, between or outside, and can find x for a percentile.
How do I calculate a 95% confidence interval?
Mean plus or minus critical value x standard error. The Confidence Interval tool uses z or t for means and Wald or Wilson intervals for proportions, from summary statistics or raw data.
How large a sample do I need?
For a proportion at 95% confidence and a 5% margin of error you need about 385 responses. The Sample Size Calculator also handles means and applies the finite population correction.
When should I use a paired t-test?
When the two sets of values come from the same subjects, such as before and after. For independent groups use Welch's t-test. The tool also reports effect size.
How do I compare two proportions?
Use the Proportion z-Test. It tests one proportion against a value, or two groups against each other, such as conversion rates in an A/B test.
When do I use a chi-square test?
For counts in categories: goodness-of-fit compares observed counts with expected ones, and the test of independence checks whether two categorical variables are related in a contingency table.
How do I compare three or more group means?
Use One-Way ANOVA. A significant F-test means at least one group mean differs; follow up with pairwise tests to find which.
What is the difference between Pearson and Spearman correlation?
Pearson measures a straight-line relationship; Spearman uses ranks and works for any steady upward or downward trend and with outliers. The tool gives r, rho, r squared and a significance test.
Which regression models are available?
Linear, quadratic, exponential, logarithmic and power models, with the fitted equation, r squared and predictions for new x values.
When should I use the binomial or Poisson distribution?
Binomial for the number of successes in a fixed number of yes-or-no trials; Poisson for the number of events in a fixed time or space with a known average rate.
What is the difference between permutations and combinations?
Permutations count arrangements where order matters (nPr); combinations count selections where it does not (nCr). The tool uses exact big integers, with or without repetition.
How do I use Bayes' theorem for a medical test?
Enter prevalence, sensitivity and specificity. The Bayes tool gives the chance a positive result is a true positive (PPV) and that a negative is a true negative (NPV).
How do I calculate expected value?
Multiply each outcome by its probability and add them up. The Expected Value & Variance tool also gives the variance and standard deviation of the distribution.
What is the margin of error?
Margin of error = critical value x standard error. The Standard Error tool calculates both for a mean or a proportion at your chosen confidence level.
Can I trust the p-values?
They use standard distributions (t, z, F, chi-square) computed to high precision. Check that your data meet each test's assumptions before relying on the result.
Ready to calculate? Scroll up to the statistics calculator, choose a tool and get your answer in seconds.