The Ultimate Guide to Institutional-Grade Financial Analysis: Streamline Corporate Projects and Academic Case Studies in Minutes
Navigating complex corporate finance, building rigorous financial statements from scratch, and formatting lengthy reports under crushing deadlines is a universal bottleneck for students, business analysts, and independent consultants alike. Staring at blank spreadsheets, wrestling with complex ratio formulas, and manually aligning horizontal and vertical analyses can easily consume hours of valuable time—often leading to formatting errors and academic friction.
To solve this exact pain point, our production-ready Financial Analysis Report & Automated Ratio Calculator Toolkit bridges the immediate gap between raw financial data and executive-level decision-making. Designed specifically for university students, finance majors, and professional consultants, this comprehensive asset provides everything required to deliver an institutional-grade financial analysis package instantly.
📦 What’s Inside the Comprehensive Toolkit?
The package comes equipped with three professionally structured files designed to eliminate setup friction and deliver rapid, high-quality execution:
- The 14-Section Formal Word Report Template (docx): A production-ready corporate report built around a complete worked example for a fictional entity, Meridian Retail Group. It provides a rigorous template structure that covers the entire analytical spectrum from executive summaries to strategic recommendations.
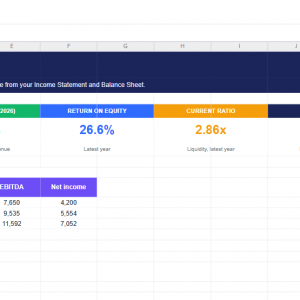
- The Dynamic Financial Ratio Calculator (xlsx): An automated Excel workbook featuring five specialized tabs (Start Here, Dashboard, Income Statement, Balance Sheet, and Ratio Analysis) engineered to compute financial health metrics on the fly.
- The Quick-Start Onboarding Guide (docx): A straightforward 5-step manual that walks users through inputting figures, verifying balance sheet checks, and moving recalculated metrics cleanly into the Word documentation.
⚙️ How It Works: The 3-Step Input-to-Output Automation Workflow
Rather than building financial models manually, our system utilizes a streamlined, formula-driven workflow that transforms raw data into a polished presentation in minutes:
[ 1. Input Data in Excel ] —> [ 2. Live Calculations & Verification ] —> [ 3. Transfer to Word Report ]
Step 1: Input Data in Excel
- Open the companion Excel file (xlsx) and navigate to the Start Heretab.
- Replace the sample figures located within the blue input cells on the Income Statementand Balance Sheet tabs with your own company data or practice case-study figures for up to three consecutive fiscal years.
Step 2: Live Calculations & Balance Check
- Observe the built-in formula engine compute metrics instantaneously.
- Check the critical “Balance check” row on the Balance Sheet tab, which confirms whether your accounts balance cleanly to zero for every year.
- Open the Dashboardtab to review live-calculated KPIs, trend charts, liquidity metrics, debt-to-equity leverage, and complete DuPont ROE breakdowns.
Step 3: Update the Word Report Narrative
- Open the Word report template (docx) and cross-reference your finalized metrics using the Ratio Analysistab as your single source of truth.
- Customize the cover page, update narrative paragraphs, and replace the table figures across all 14 structured sections to match your final corporate or academic project.
📋 Detailed Breakdown of the 14-Section Report Template
When you download the report template, you gain access to a fully mapped corporate document layout that ensures no critical financial metric is left out:
- Executive Summary: High-level synthesis of multi-year financial performance, core strengths, and overarching trajectory.
- Company & Industry Overview: Contextual framework detailing business operations, market standing, and competitive positioning.
- Financial Statements (3-Year): Clean, structured tables mapping historical income statements and balance sheet metrics.
- Horizontal & Vertical Analysis: Deep-dive percentage changes over time and common-size statement breakdowns.
- Ratio Analysis: Comprehensive evaluation spanning liquidity, asset management, leverage, and profitability ratios.
- DuPont ROE Decomposition: Multi-factor breakdown analyzing net profit margin, asset turnover, and financial leverage.
- SWOT Analysis: Strategic matrix evaluating internal strengths/weaknesses alongside external market opportunities/threats.
- Risk Assessment: Systematic identification and evaluation of operational, financial, and strategic exposures.
- Peer & Industry Benchmarking: Comparative analysis positioning company performance against broader market standards.
- Key Findings & Insights: Analytical takeaways derived directly from calculated data trends.
- Strategic Recommendations: Actionable, data-backed initiatives designed for executive decision-makers.
- Conclusion: Final synthesis of the business’s overall viability and financial outlook.
- Appendix A – Consolidated Statements: Comprehensive reconciliation consolidating every statement shown throughout the report for rapid reference.
- Appendix B – Ratio Formula Glossary: Detailed definitions and mathematical formulas used for every calculation in the workbook.
🎯 Where and Why to Use This Toolkit
- For University & College Students:Perfect for finance, accounting, and corporate strategy majors who need to tackle complex semester projects, case studies, or valuation reports without spending days formatting documents.
- For Freelancers & Business Consultants:An efficient, plug-and-play asset to rapidly audit small business clients, evaluate financial health, and present clean, professional reports.
- For Digital Store Owners:An exceptional, high-value digital asset to feature on a modern WordPress store powered by Blocksy, Elementor, and direct checkout funnels—delivering instant value to users seeking professional templates.
Stop wasting time on manual formatting and boilerplate calculations. Download your complete toolkit today and execute professional-grade financial modeling and reporting in minutes!