Try our free AI tools – no sign-up needed!


Confidence Interval Calculator Online: How to Calculate a Confidence Interval for a Mean or Proportion
Need an interval now? The free confidence interval calculator online gives t, z, Wald and Wilson intervals from summary numbers or raw data, with the working, free and without login.
Jump to the free tool ↓A sample average on its own hides how uncertain it is. “Customers wait 50 minutes on average” sounds precise, but is the true average 49–51 or 40–60? A confidence interval answers that question. It gives a range of plausible values for the population mean or proportion, based on your sample size, its spread and the confidence level you choose.
This guide explains how to calculate confidence interval limits by hand, what 95% confidence really means, and when to use t, z, Wald or Wilson. It then walks you through the free Orixiva confidence interval calculator, a confidence interval calculator online without login, signin or signup that shows every step.
Key takeaways
- Every interval has the same shape: estimate ± critical value × standard error.
- For a mean with σ unknown (the usual case), use t: x̄ ± t* · s/√n.
- For a proportion, the Wilson interval is more reliable than the simple Wald interval, especially with small counts.
- Higher confidence gives a wider interval; a larger sample gives a narrower one (four times the sample halves the margin).
- The Orixiva calculator covers t, z, raw data and proportions at 80% to 99.9% confidence, free and without login.
What is a confidence interval?
Quick answer: A confidence interval is a range, calculated from sample data, that is likely to contain an unknown population value such as a mean or a proportion. A 95% confidence interval is built by a method that captures the true value in about 95% of repeated samples.
Every confidence interval has three parts:
Point estimate
Your best single guess: the sample mean x̄ or the sample proportion p̂.
Margin of error
Critical value × standard error. It sets how far the interval reaches on each side.
Confidence level
Usually 90%, 95% or 99%. Higher confidence needs a larger critical value.
Sample size
Larger samples shrink the standard error and narrow the interval.
What does 95% confidence actually mean?
The 95% describes the method, not one particular interval. If you took many random samples and built a 95% interval from each, about 95 out of 100 intervals would contain the true mean. Any single interval either contains it or does not; you just do not know which.
Correct wording
About the method.
✓
- “We are 95% confident the mean is between 45.9 and 54.1.”
- “The method captures the true mean 95% of the time.”
Common misreading
About the data.
✗
- “95% of customers wait 45.9–54.1 minutes.”
- “There is a 95% chance the sample mean is in the interval.”
The interval is about the average, not individual values. Individual waits are far more spread out than the interval for their mean.
Confidence interval formulas
General form
estimate ± critical value × standard error
- margin of error
- critical value × standard error
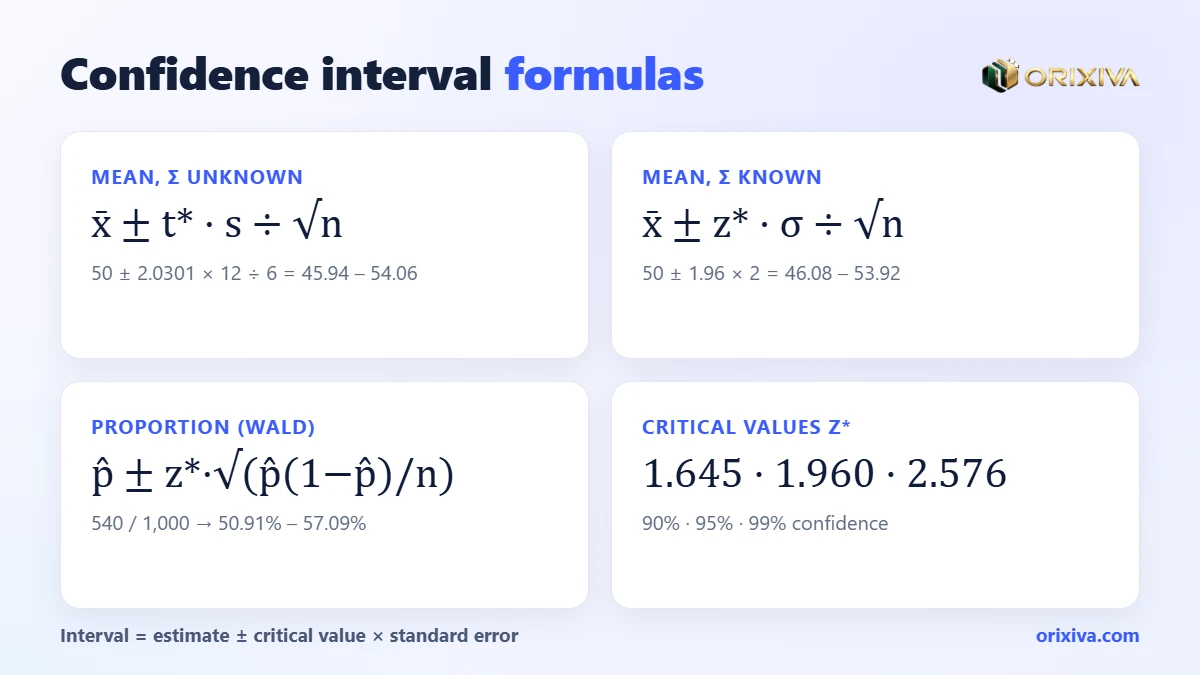
Mean, σ unknown (t interval): the usual case
x̄ ± t*n−1 · s ÷ √n
- x̄, s
- sample mean and sample standard deviation
- t*n−1
- t critical value with n − 1 degrees of freedom
Mean, σ known (z interval)
x̄ ± z* · σ ÷ √n
- z*
- 1.645 (90%), 1.960 (95%), 2.576 (99%)
Proportion: Wald (simple)
p̂ ± z* · √(p̂(1 − p̂) ÷ n)
- p̂
- x ÷ n, the sample proportion
Proportion: Wilson score (recommended)
(p̂ + z²/2n ± z·√(p̂(1 − p̂)/n + z²/4n²)) ÷ (1 + z²/n)
- z
- z* for your confidence level
These are the exact formulas the Orixiva calculator uses. It computes the t critical value numerically for any degrees of freedom, so you never need a printed t-table.
Critical values for common confidence levels
| Confidence | z* | t* (df 10) | t* (df 30) | t* (df 120) |
|---|---|---|---|---|
| 80% | 1.282 | 1.372 | 1.310 | 1.289 |
| 90% | 1.645 | 1.812 | 1.697 | 1.658 |
| 95% | 1.960 | 2.228 | 2.042 | 1.980 |
| 98% | 2.326 | 2.764 | 2.457 | 2.358 |
| 99% | 2.576 | 3.169 | 2.750 | 2.617 |
| 99.9% | 3.291 | 4.587 | 3.646 | 3.373 |
t* is always larger than z* and moves towards it as the degrees of freedom grow.
How to calculate confidence interval by hand in 5 steps
- Pick the parameter. A mean (average) or a proportion (percentage)?
- Find the estimate. x̄ from the data, or p̂ = successes ÷ n.
- Find the standard error. s ÷ √n for a mean; √(p̂(1 − p̂) ÷ n) for a proportion.
- Find the critical value. t* with n − 1 df for a mean with σ unknown, z* otherwise.
- Build the interval. Estimate ± critical value × SE, then write a one-sentence interpretation.
Six worked confidence interval examples
Example 1: mean, σ unknown (t)
A sample of n = 36 customers waits x̄ = 50 minutes with s = 12.
- SE = 12 ÷ √36 = 2.
- t* (95%, df 35) = 2.0301.
- Margin = 2.0301 × 2 = 4.06.
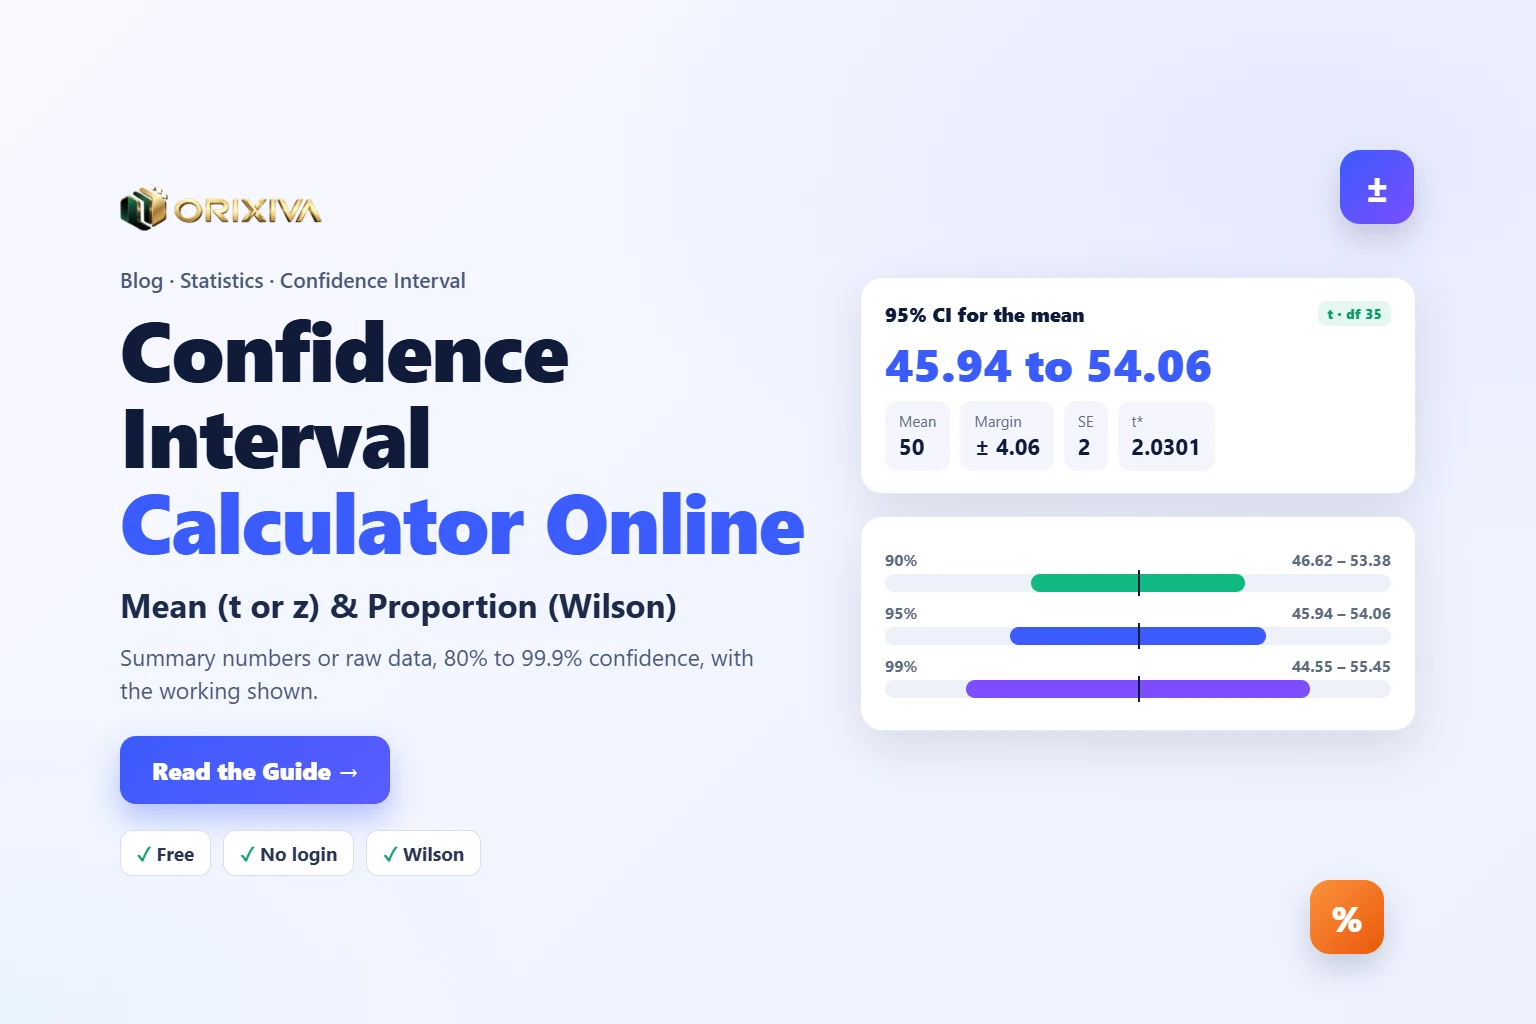
- 95% CI: 45.94 to 54.06 minutes.
Mean50
Margin of error± 4.06
Standard error2
t* (df = 35)2.0301
Example 2: mean, σ known (z)
Same numbers, but σ = 12 is known from long-run process data. Margin = 1.96 × 2 = 3.92, so the 95% CI is 46.08 to 53.92. It is slightly narrower because z* is smaller than t*.
Example 3: from raw data
Ten measurements: 48, 52, 55, 47, 50, 53, 49, 51, 58, 46.
- x̄ = 50.9 and s = 3.725.
- SE = 3.725 ÷ √10 = 1.178; t* (df 9) = 2.2622.
- Margin = 2.665.
- 95% CI: 48.24 to 53.56.
Example 4: proportion in a large survey
540 of 1,000 people say yes, so p̂ = 54%. Wilson 95% interval: 50.90% to 57.07%. Wald gives 50.91% to 57.09%, nearly identical because the counts are large.
This is the same idea behind the “margin of error ±3 points” printed under opinion polls. A poll of about 1,000 people has a 95% margin of roughly ±3 percentage points for a result near 50%. Smaller subgroups in the same poll, such as one age band of 150 people, have much wider intervals, so differences between subgroups need careful reading before anyone draws conclusions from them.
Example 5: proportion with small counts
3 defects in 40 items: p̂ = 7.5%. Wald gives −0.66% to 15.66%, which includes impossible negative values. Wilson gives 2.58% to 19.86%, which stays inside 0–100% and has better coverage. This is why the calculator leads with Wilson.
Example 6: the same data at three confidence levels
Sleep study: n = 25, x̄ = 7.1 hours, s = 1.5 (SE = 0.3).
| Level | t* (df 24) | Margin | Interval (hours) |
|---|---|---|---|
| 90% | 1.711 | ± 0.51 | 6.59 to 7.61 |
| 95% | 2.064 | ± 0.62 | 6.48 to 7.72 |
| 99% | 2.797 | ± 0.84 | 6.26 to 7.94 |
Flowchart: which confidence interval should you use?
- What are you estimating?An average value or a percentage of yes answers
- Mean or proportion?MeanGo to the next questionProportionUse Wilson (Wald for comparison)
- Do you know σ for the whole population?Yes, rarelyz interval: x̄ ± z*·σ/√nNo, usuallyt interval: x̄ ± t*·s/√n
- Do you have raw values or a summary?Raw values“Mean from raw data (t)”SummaryEnter mean, SD and n
- Report the interval with the level and n“95% CI 45.9 to 54.1 minutes, n = 36”
What makes a confidence interval wider or narrower?
Three things control the width: the confidence level, the spread of the data and the sample size.
95% margin of error as the sample grows (s = 12)
Margin = t* × 12 ÷ √n. Quadrupling n roughly halves it.
n = 9
± 9.22
n = 16
± 6.39
n = 36
± 4.06
n = 64
± 3.00
n = 144
± 1.98
n = 400
± 1.18
Bars to scale. To plan the n you need in advance, use the sample size calculator.
Skewed data and very small samplesThe t interval assumes the sample mean is roughly normal. That is reasonable when the data are fairly symmetric or n is about 30 or more. With a handful of strongly skewed values, such as incomes or repair times with one huge outlier, the interval can be misleading. Look at a histogram first with the frequency distribution table calculator, consider a log transformation or a median-based method, and say clearly in your report which approach you used.
How to calculate confidence interval online with the free calculator (step by step)
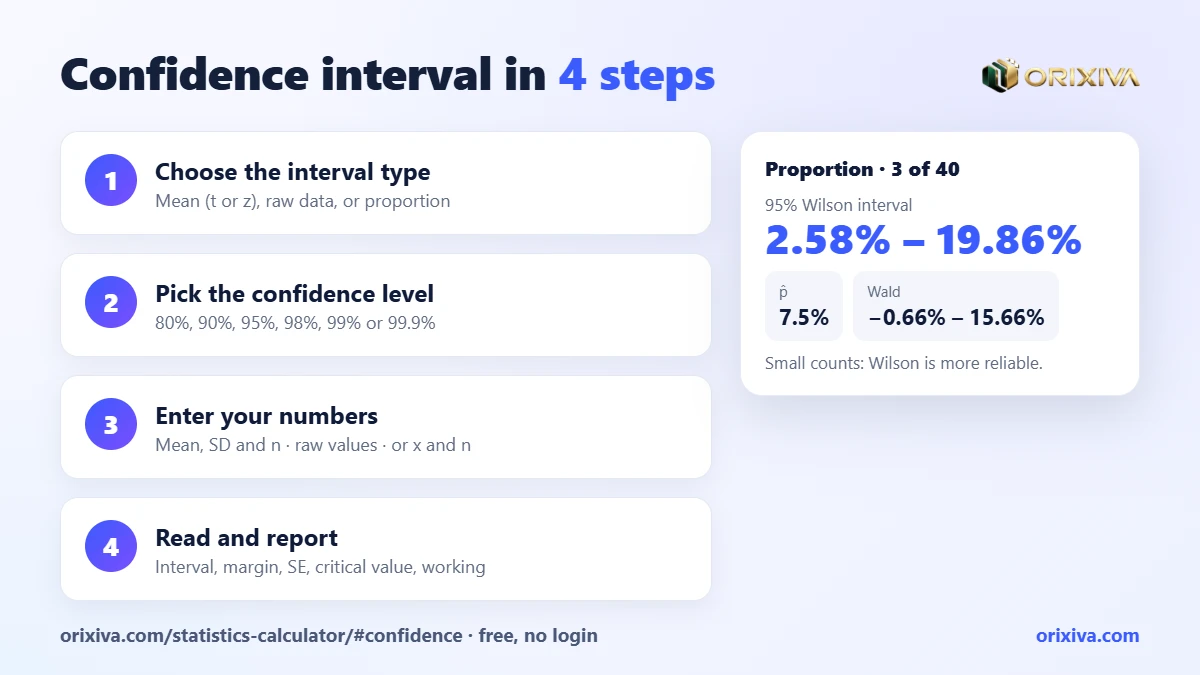
- Open the calculator. Go to the Orixiva confidence interval calculator. No login, signin or signup is needed.
- Choose “Interval for”. Mean, σ unknown (t); Mean, σ known (z); Mean from raw data (t); or Proportion. Only the matching fields appear.
- Pick the confidence level. 80%, 90%, 95%, 98%, 99% or 99.9%.
- Enter your numbers. Sample mean, standard deviation and n; or paste raw values separated by commas, spaces or new lines; or enter n and the number of successes x for a proportion.
- Read the interval. For a mean you get the interval, mean, margin of error, standard error, critical value with its degrees of freedom, and n. For a proportion you get the Wilson interval, sample proportion, Wald interval, Wald margin and z*.
- Read the interpretation. A plain-English sentence states what the interval means and the assumptions behind it. With small counts, it warns you to rely on Wilson.
- Check the working and save. “How it was calculated” shows the SE, critical value and interval steps. Copy, download as TXT, print, or press Calculate to keep it in Recent calculations and export as CSV.
Results update as you type, and nothing is uploaded: the confidence interval calculator runs entirely in your browser.
Who uses a confidence interval calculator?
Students
Check assignments and see each step, from the standard error to the final interval.
Researchers and thesis writers
Report means and proportions with 95% CIs, as most journals and examiners expect.
Survey and market researchers
Turn “54% said yes” into “51% to 57% with 95% confidence”.
Lab and quality teams
Express the uncertainty of an average measurement or defect rate.
Health and public sector
Summarise average waiting times or rates privately, without uploading records.
Product and A/B testers
Show how precise a conversion rate is before making a decision.
Confidence intervals and hypothesis tests
A 95% confidence interval and a two-sided test at α = 0.05 tell a consistent story. If a hypothesised value lies outside the 95% interval, the test rejects it; if it lies inside, the test does not. In Example 1, a claimed average of 55 minutes is outside 45.94–54.06, so a one-sample t-test would reject it at the 5% level. Intervals are often more useful than a p-value because they show the size of the effect and its uncertainty. See t-test and p-value explained for the testing side.
How to report a confidence interval
A good report gives the estimate, the interval, the confidence level and the sample size, in that order. Readers should never have to guess which level you used.
| Context | Example wording |
|---|---|
| Plain English | Customers waited 50 minutes on average (95% CI 45.9 to 54.1 minutes, n = 36). |
| Academic (APA-style) | M = 50.0, SD = 12.0, 95% CI [45.9, 54.1]. |
| Survey | 54% said yes (95% CI 50.9% to 57.1%, Wilson, n = 1,000). |
| Quality report | Defect rate 7.5% (95% Wilson CI 2.6% to 19.9%, 3 of 40 items). |
Round the limits to the same precision as the data, name the method for proportions, and add one sentence on what the range means for the decision you are making. A wide interval is not a failure; it is honest information that more data may be needed.
Do overlapping intervals mean “no difference”?
Not necessarily. Two 95% intervals can overlap a little while the difference between the groups is still statistically significant. To compare two groups properly, test the difference directly with the two-sample t-test or the proportion z-test instead of eyeballing the overlap.
Confidence intervals in Excel and Google Sheets
| Task | Formula | Example result |
|---|---|---|
| t margin (α 0.05, s 12, n 36) | =CONFIDENCE.T(0.05,12,36) | 4.060 |
| z margin (σ 12, n 36) | =CONFIDENCE.NORM(0.05,12,36) | 3.920 |
| t* for 95%, df 35 | =T.INV.2T(0.05,35) | 2.0301 |
| Lower limit from data in A2:A11 | =AVERAGE(A2:A11)-CONFIDENCE.T(0.05,STDEV.S(A2:A11),10) | 48.24 |
Spreadsheets have no built-in Wilson interval, so proportions are where the calculator saves the most effort.
Mistakes to avoid
Using z when σ is estimated
With a sample SD and a small n, z makes the interval too narrow. Use t unless σ really is known.
Confusing SD and SE
The SD describes individual values; the SE (SD ÷ √n) describes the mean. Use SE in the margin.
Using Wald with small counts
Wald can produce negative limits or undercover. Prefer Wilson when n·p̂ or n·(1 − p̂) is under 10.
Ignoring how the sample was taken
A confidence interval assumes a random, independent sample. It cannot fix a biased sample.
Reporting too many decimals
An interval of 45.93978 to 54.06021 suggests false precision. Round to the precision of your measurements, usually one or two decimals.
Reading it as a range for individuals
The interval covers the population mean, not 95% of individual values.
The NIST/SEMATECH e-Handbook page on confidence limits for the mean explains the definition and why larger samples give more precise estimates.
Your turn: What are you estimating: a mean time, a score or a survey percentage? Share your n, your interval and how you reported it in the comments, so other readers can compare.
Calculate your confidence interval now
Enter a mean, SD and n, paste raw data, or enter successes and n for a proportion. Get t, z, Wald or Wilson intervals with the working. A confidence interval calculator online without login, free, and nothing leaves your browser.
Open the confidence interval calculator → Need another statistics or data tool? Search on orixiva.comRelated guides: sample size calculator, normal distribution calculator online, frequency distribution table calculator and the standard error and margin of error calculator.
Confidence interval questions people often ask
Is there a confidence interval calculator online without login, free?
Yes. The Orixiva confidence interval calculator is free, needs no login, signin or signup, and works in any modern browser.
How to calculate confidence interval for a mean?
Compute SE = s ÷ √n, find t* for your level with n − 1 degrees of freedom, and use x̄ ± t* × SE.
How do I calculate a confidence interval for a proportion?
Find p̂ = x ÷ n and use the Wilson formula, or the simpler Wald formula p̂ ± z*·√(p̂(1 − p̂)/n) for large counts.
Should I use z or t?
Use t when the standard deviation comes from your sample, which is almost always. Use z only when σ is known for the population.
What is the margin of error?
The half-width of the interval: critical value × standard error. The interval is the estimate plus and minus this amount.
Why is a 99% interval wider than a 95% interval?
To capture the true value more often, the method needs a larger critical value (2.576 instead of 1.960 for z), which widens the interval.
Can I calculate a confidence interval from raw data?
Yes. Choose “Mean from raw data (t)” and paste the values; the calculator finds the mean, SD and n for you.
Why does the calculator show Wilson and Wald?
Wilson is more accurate, especially with small counts or proportions near 0% or 100%. Wald is shown for comparison because many textbooks use it.
What confidence levels are available?
80%, 90%, 95%, 98%, 99% and 99.9%.
Is my data stored?
No. The calculator runs in your browser, and your numbers are not sent to or stored on Orixiva’s server.
How can I make my interval narrower?
Collect a larger sample, reduce measurement noise, or accept a lower confidence level. Plan n with a sample size calculator.


[…] answers the planning question before data collection, the mirror image of a confidence interval calculator, which measures precision after the data are in. Plan with one, report with the […]
[…] Confidence Interval Calculator Online: 6 Easy Worked Examples (Free) […]
[…] Confidence Interval Calculator Online: 6 Easy Worked Examples (Free) […]