Try our free AI tools – no sign-up needed!


Sample Size Calculator: How to Calculate Sample Size for a Survey or Research Study
Planning a survey or study? The free sample size calculator works out the responses you need for a proportion or a single mean, with population and response-rate adjustments, free and without signup.
Jump to the free tool ↓“How many people do I need to ask?” is one of the first questions in any survey, thesis or market study. Ask too few and your margin of error is so wide that the results say little. Ask too many and you waste time and money. A sample size calculator finds the balance from three or four simple inputs: how confident you want to be, how precise the answer must be, and how variable the population is.
This guide explains how to calculate sample size in research step by step, with the formulas for a proportion and for a single mean, worked examples, ready-made tables and charts. It then shows how to use the free Orixiva sample size calculator, which works online without login, signin or signup and shows the working behind every number.
Key takeaways
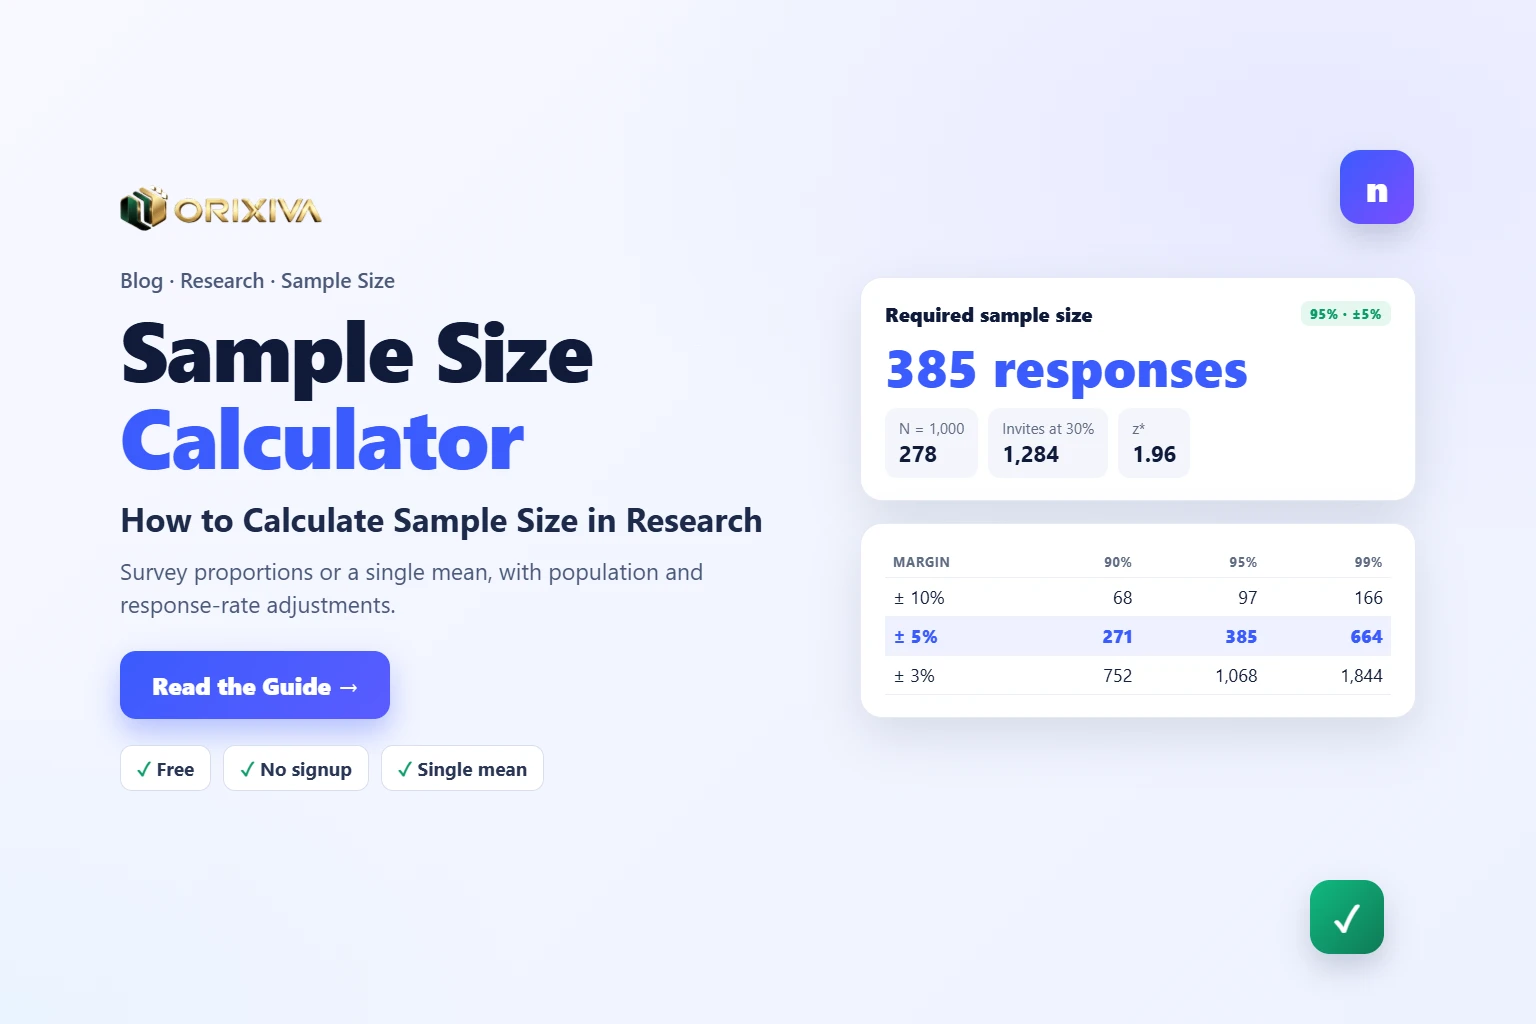
- For a survey percentage at 95% confidence and ±5% margin, you need 385 completed responses (using p = 50%).
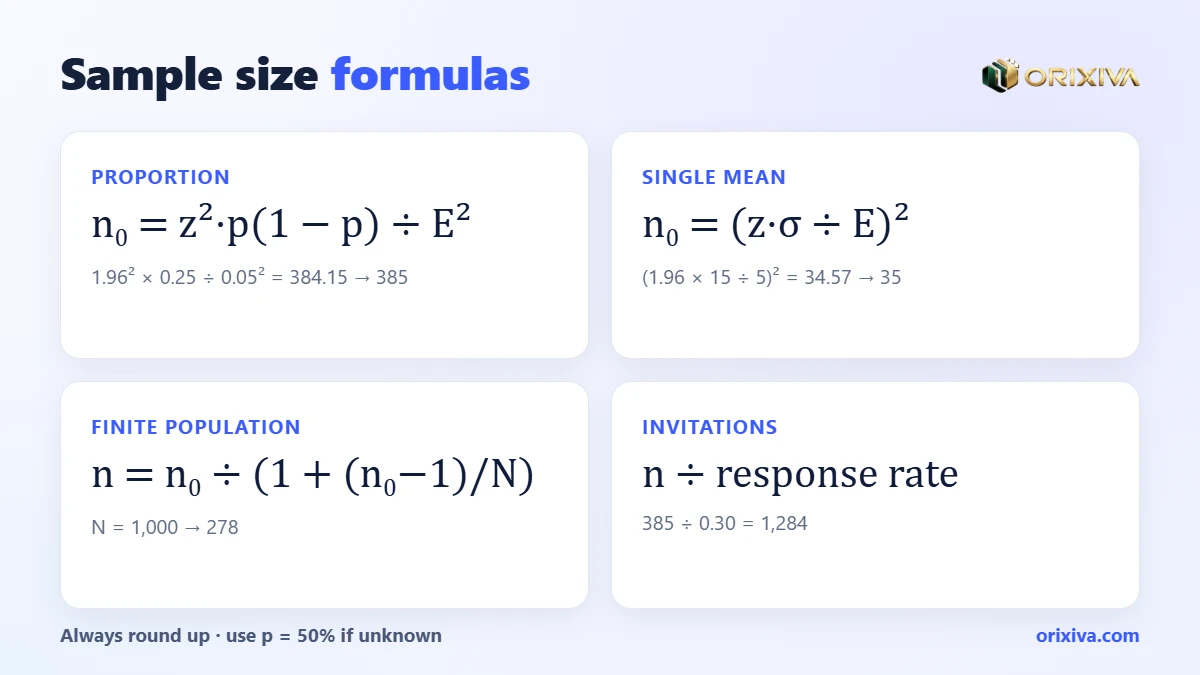
- Proportion formula: n₀ = z²·p(1 − p) ÷ E². Single-mean formula: n₀ = (z·σ ÷ E)².
- Halving the margin of error multiplies the number of responses by about four.
- For a small population, apply the finite population correction: n = n₀ ÷ (1 + (n₀ − 1) ÷ N). For N = 1,000, 385 becomes 278.
- Divide by the expected response rate to know how many people to invite. The Orixiva calculator does all of this for free, without login.
What does a sample size calculator do?
Quick answer: A sample size calculator tells you how many completed responses or measurements you need so that your estimate of a percentage or an average falls within a chosen margin of error at a chosen confidence level. The classic result is 385 responses for ±5% at 95% confidence.
It answers the planning question before data collection, the mirror image of a confidence interval calculator, which measures precision after the data are in. Plan with one, report with the other.
The inputs explained
Confidence level
How sure you want to be that the true value is within the margin. 95% is standard; 90% and 99% are common alternatives.
Margin of error (E)
How close the estimate must be: ±5 percentage points for a survey, or ±2 kg for an average weight.
Expected proportion
Your best guess of the percentage. If unknown, use 50%: it gives the largest, safest sample.
Standard deviation
For a mean only: how much individual values vary, from a pilot study or past research.
Population size
Optional. Only matters when the population is small, such as 500 employees.
Response rate
The share of invited people you expect to reply. It turns responses needed into invitations to send.
Sample size formulas
Proportion (surveys, yes/no questions)
n0 = z² · p(1 − p) ÷ E²
- z
- critical value: 1.645 (90%), 1.960 (95%), 2.576 (99%)
- p
- expected proportion as a decimal (0.5 if unknown)
- E
- margin of error as a decimal (0.05 for ±5%)
Single mean (measurements, scores, times)
n0 = (z · σ ÷ E)²
- σ
- estimated standard deviation
- E
- margin of error in the same units as the data
Finite population correction
n = n0 ÷ (1 + (n0 − 1) ÷ N)
- N
- total population size
Invitations to send
invitations = n ÷ response rate
- round up
- always round the result up to the next whole number
These are the formulas the Orixiva calculator applies, in this order, with z computed precisely for your confidence level.
How to calculate sample size in research: 6 steps
- Define the main outcome. Is it a percentage (share who agree) or an average (mean score, time, weight)?
- Choose the confidence level. 95% unless your field or supervisor says otherwise.
- Set the margin of error. ±5% is common for surveys; for a mean, choose the smallest difference that matters in practice.
- Estimate the variability. Use p = 50% if unsure; for a mean, take σ from a pilot study or a published study.
- Adjust for the population and response rate. Apply the finite population correction if N is small, then divide by the expected response rate.
- Document it. Write the formula, inputs and result in your methods section so readers can check it.
Methods-section template“Assuming 95% confidence, a ±5% margin of error and p = 0.5, the required sample was 385. With a population of 1,000, the finite population correction gave 278 completed responses. Allowing for a 30% response rate, 927 invitations were sent.”
Six worked examples
Example 1: national survey
95% confidence, ±5%, p unknown (0.5), very large population.
- n₀ = 1.96² × 0.5 × 0.5 ÷ 0.05² = 3.8415 × 0.25 ÷ 0.0025.
- n₀ = 384.15.
- Round up: 385 responses.
Example 2: company of 1,000 employees
Same settings, N = 1,000. n = 384.15 ÷ (1 + 383.15 ÷ 1,000) = 277.7, so 278 responses.
Example 3: allowing for non-response
You expect 30% of invited people to reply. For 385 responses, invite 385 ÷ 0.30 = 1,284 people. For the company in Example 2, invite 278 ÷ 0.30 = 927.
Example 4: sample size calculator for single mean
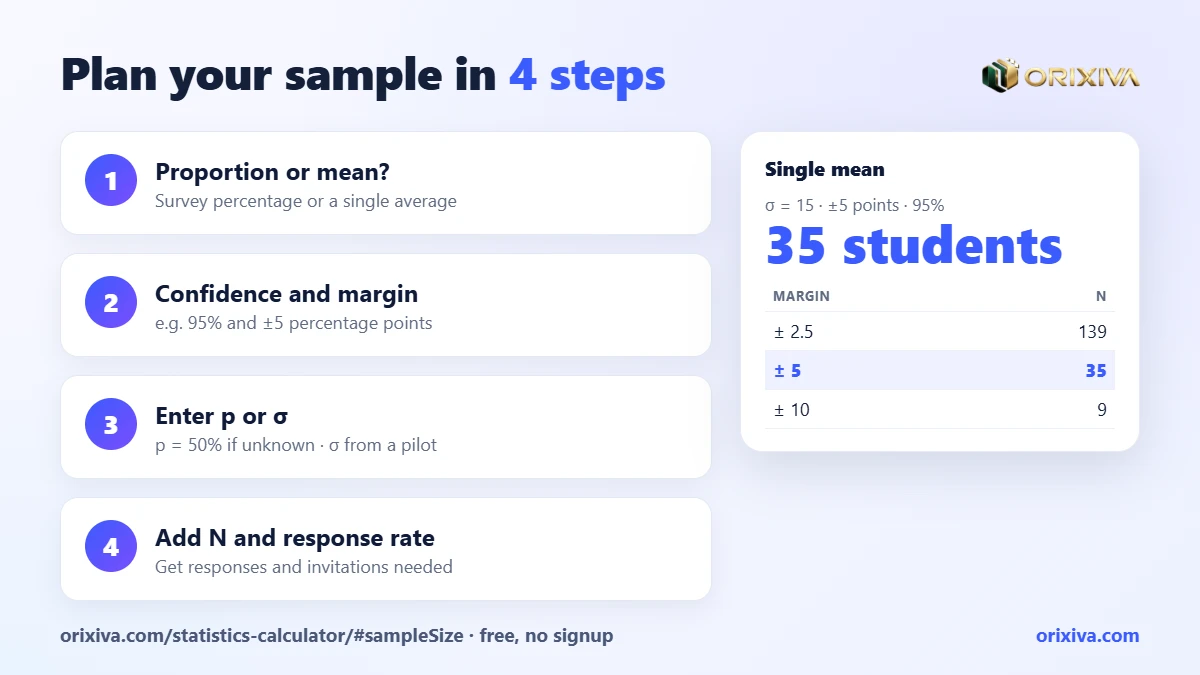
You want the average test score within ±5 points at 95% confidence, and past results suggest σ = 15.
- n₀ = (1.96 × 15 ÷ 5)² = 5.88² = 34.57.
- Round up: 35 students.
- For ±3 points: (1.96 × 15 ÷ 3)² = 96.04, so 97 students.
Example 5: a stricter mean study
A lab wants a mean within ±2 units at 99% confidence with σ = 10. n₀ = (2.576 × 10 ÷ 2)² = 165.87, so 166 measurements.
Example 6: you already know roughly what p is
A previous survey found about 20% of customers use a feature. With p = 0.2 at 95% and ±5%: n₀ = 3.8415 × 0.2 × 0.8 ÷ 0.0025 = 245.85, so 246 responses, 139 fewer than the 50% default.
Survey ±5%, 95%385
N = 1,000278
Invitations at 30%1,284
Mean, σ 15, ±535
Sample size table for surveys
Required responses for a proportion with p = 50% and a large population:
| Margin of error | 90% confidence | 95% confidence | 99% confidence |
|---|---|---|---|
| ± 10% | 68 | 97 | 166 |
| ± 5% | 271 | 385 | 664 |
| ± 3% | 752 | 1,068 | 1,844 |
| ± 2% | 1,691 | 2,401 | 4,147 |
| ± 1% | 6,764 | 9,604 | 16,588 |
Flowchart: plan the number of responses
- Define the outcome you will estimateOne main question drives the calculation
- Percentage or average?Percentagen₀ = z²·p(1 − p) ÷ E²Averagen₀ = (z·σ ÷ E)²
- Is the population small (a few thousand or less)?Yesn = n₀ ÷ (1 + (n₀ − 1) ÷ N)NoKeep n₀
- Divide by the expected response rateInvitations = n ÷ rate; round up
- Record the inputs in your methodsConfidence, margin, p or σ, N and response rate
Does population size matter?
Surprisingly little, once the population is large. The finite population correction only makes a real difference when your sample would be a sizeable share of the population.
Responses needed by population size (95%, ±5%, p = 50%)
After the finite population correction.
N = 200
132
N = 500
218
N = 1,000
278
N = 5,000
357
N = 10,000
370
N = 100,000
383
Very large
385
A city of a million and a country of a hundred million both need about 385.
How to estimate σ for a single-mean study
The mean formula needs a standard deviation before you have collected the data. Practical options, from best to roughest:
- A pilot study: measure 10–30 units, then use the sample SD from the Descriptive Statistics calculator.
- Published research: use the SD reported by a similar study, ideally with a similar population.
- Range rule of thumb: for roughly normal data, σ ≈ (expected maximum − expected minimum) ÷ 4. Scores from 40 to 100 suggest σ ≈ 15.
When unsure, round σ up. Overestimating σ gives a slightly larger, safer sample; underestimating it leaves you short of precision.
How to use the free sample size calculator (step by step)
- Open the calculator. Go to the Orixiva sample size calculator. It works without login, signin or signup.
- Choose what you will estimate. “Proportion (surveys)” or “Mean”. The form shows the matching fields.
- Pick the confidence level. 80%, 90%, 95%, 98%, 99% or 99.9%.
- Enter the margin of error. As ± percentage points for a proportion (5), or ± units for a mean.
- Enter p or σ. Expected proportion (50% if unknown) or the estimated standard deviation.
- Add the population and response rate (optional). Leave population blank for a very large population; set the response rate to 100% to skip that step.
- Read and save the result. You get the required responses, the size without population correction, the invitations needed and z*, plus a table of results at 0.5×, 0.75×, 1×, 1.5× and 2× your margin. Copy, download as TXT, print, or press Calculate to keep it and export as CSV.
The working is shown under the result, and everything runs in your browser, so your study details stay private.
Choosing who to include: sampling methods
The formulas assume a random sample. How you pick participants decides whether the answer is trustworthy, so choose the method before you start inviting people:
| Method | How it works | Good for |
|---|---|---|
| Simple random | Every member has the same chance, e.g. random numbers from a full list | Staff lists, customer databases |
| Systematic | Every k-th person from a list after a random start | Invoices, patient files, production lines |
| Stratified | Random samples within groups such as region or age band | Reporting results for each subgroup |
| Cluster | Randomly choose whole groups, such as schools or villages | Large, spread-out populations |
| Convenience | Whoever is easy to reach | Pilots only; results may be biased |
Cluster samples usually need more participants than the simple formula suggests, because people in the same cluster tend to answer alike. If you use clusters, ask a statistician about the design effect, or at least inflate the target and explain why.
Plan for drop-outs tooIn studies that follow people over time, some participants leave before the end. If you expect 15% to drop out, divide the target by 0.85 at the planning stage, in the same way as the response-rate step.
Who uses a sample size calculator?
Students and thesis writers
Justify the sample in a proposal and methods chapter with a clear formula.
Survey designers
Plan customer, employee and community surveys and their invitation lists.
Market researchers
Balance budget against precision before buying panel responses.
Health and NGO teams
Size community surveys and audits when the population is known.
Quality and lab teams
Decide how many units to measure to pin down an average.
HR and public sector
Plan staff and service surveys for organisations with a fixed headcount.
Precision-based vs power-based planning
Precision (this calculator)
Estimate a value within ±E.
n for a margin
- Surveys, prevalence, average levels
- Inputs: confidence, E, p or σ
Power (hypothesis tests)
Detect a difference between groups.
n for a test
- Trials, A/B tests, comparisons
- Inputs: α, power, effect size
The Orixiva calculator answers the precision question. If your study must show that two groups differ, with a chosen power such as 80%, use a power analysis instead and state it in your methods. Many studies report both: a precision target for descriptive results and a power calculation for the main comparison.
Formulas in Excel or Google Sheets
| Task | Formula | Result |
|---|---|---|
| z for 95% | =NORM.S.INV(0.975) | 1.960 |
| Proportion, 95%, ±5%, p 0.5 | =ROUNDUP(NORM.S.INV(0.975)^2*0.5*0.5/0.05^2,0) | 385 |
| Single mean, σ 15, ±5 | =ROUNDUP((NORM.S.INV(0.975)*15/5)^2,0) | 35 |
| Finite population (n₀ in B2, N in C2) | =ROUNDUP(B2/(1+(B2-1)/C2),0) | 278 |
Turning the number into a realistic plan
A calculated target is only useful if you can reach it. Before you commit, check three practical points. First, cost: multiply the invitations by any incentive or panel fee per completed reply. Second, time: if you can collect 40 replies a week, 385 replies take about ten weeks. Third, quality: build in a few extra responses for incomplete or invalid answers that you will remove during cleaning. If the plan is out of reach, widen the margin slightly (for example from ±4% to ±5%) rather than quietly collecting fewer replies than you report.
Mistakes to avoid
Confusing responses with invitations
385 is the number of completed responses. If only a quarter reply, you must invite about 1,540 people.
Entering the margin as a decimal
The calculator expects ±5 for 5%, not 0.05. A margin of 0.05 percentage points would need millions of responses.
Ignoring subgroups
If you will report men and women separately, each subgroup needs its own adequate sample, not just the total.
Assuming a big sample fixes bias
A large but self-selected sample can still be badly biased. Random or representative sampling matters more than size.
Using p = 50% for a mean
Proportions and means use different formulas. For averages, choose “Mean” and supply σ.
The NIST/SEMATECH e-Handbook notes that increasing the sample size is one way to obtain more precise estimates of the mean, which is exactly the trade-off this calculation makes explicit.
Your turn: What are you planning: a thesis survey, a customer study or a lab experiment? Share your confidence level, margin and population in the comments, and how many responses you managed to collect.
Calculate your sample size now
Choose a proportion or a single mean, set the confidence and margin, and add your population and response rate. The free sample size calculator shows the result, a margin table and the working, without login, and nothing leaves your browser.
Open the sample size calculator → Need a different research or statistics tool? Search on orixiva.comRelated guides: confidence interval calculator online, normal distribution calculator online, frequency distribution table calculator and t-test and p-value explained.
Sample size questions people often ask
How do I calculate sample size online without signup, free?
Open the Orixiva sample size calculator, choose proportion or mean, enter the confidence level, margin of error and p or σ, and read the result. It is free and needs no login or signup.
Why is 385 the magic number for surveys?
It is the result of z²·p(1 − p) ÷ E² with 95% confidence (z = 1.96), p = 0.5 and E = 0.05: 384.15, rounded up to 385.
Is there a sample size calculator for single mean?
Yes. Choose “Mean” in the Orixiva calculator, enter σ and the margin in your data’s units. It uses n₀ = (z·σ ÷ E)².
How to calculate sample size in research with a known population?
Calculate n₀ first, then apply n = n₀ ÷ (1 + (n₀ − 1) ÷ N). The calculator does this when you enter the population size.
Why use p = 50% when I don’t know the proportion?
p(1 − p) is largest at 0.5, so it gives the biggest, most conservative result.
Does a bigger population need a bigger sample?
Only up to a point. Above about 20,000, the required sample barely changes: 95% and ±5% need about 385 whatever the size.
How does response rate change the plan?
Divide the responses needed by the expected response rate. At 30%, 385 responses need 1,284 invitations.
What margin of error should I choose?
±5% is common for general surveys; ±3% for more precise polls. For a mean, choose the smallest difference that would change a decision.
Does this replace a power analysis?
No. It sizes a study for precision. For detecting a difference between groups, use a power analysis.
Is my study information stored?
No. The calculator runs in your browser and sends nothing to Orixiva’s server.
Can I see how the sample changes with the margin?
Yes. The result includes a table of required responses at half, three-quarters, one-and-a-half and twice your margin of error.

[…] Sample Size Calculator: How to Calculate Sample Size in Research (6 Easy Steps) […]
[…] Sample Size Calculator: How to Calculate Sample Size in Research (6 Easy Steps) […]