Try our free AI tools – no sign-up needed!


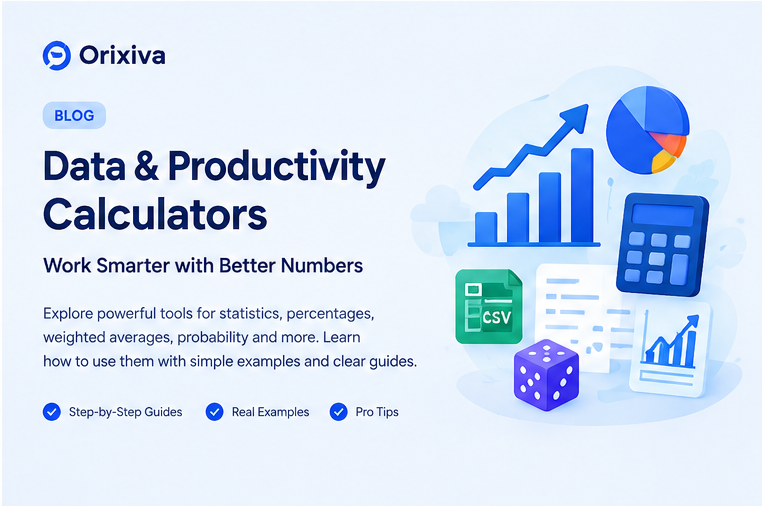
How Free Online Data & Productivity Calculators: A Practical Guide | Orixiva
Explore Orixiva’s data calculators for statistics, percentage changes, weighted averages, probability, random numbers and quick CSV analysis.
Orixiva guide · Data, statistics and everyday analysis
When numbers feel messy, a clear calculation can help you understand what they mean. Data & Productivity Calculators bring eight practical tools together: statistics, percentage change, weighted averages, z-scores, probability, combinations and permutations, random generation, and CSV analysis. This guide explains what each tool does, when to use it, and how to read the result.
8 browser-based toolsStep-by-step resultsCSV analysisNo account required by this tool
Start here: Choose the tool that matches your question. You do not need to understand every formula before you begin. Enter clean inputs, calculate, then read the method and limitations shown with the result.
Which data or productivity calculator should you use?
The best calculator depends on the question you want to answer. Use this quick guide to choose a starting point.
| Your question | Use this tool | What it helps you see |
|---|---|---|
| What does this set of numbers look like? | Descriptive Statistics | Mean, median, mode, spread, quartiles, outliers and a histogram. |
| How much did a value rise or fall? | Percentage Change | Change as a percentage, applying or reversing a percentage, or comparing two values. |
| How do different weights affect an average? | Weighted Average | A weighted mean, weighted spread, or the score needed for a target. |
| How far is a value from the average? | Z-Score | A standardized score and normal-distribution probability estimates. |
| What is the chance of an event? | Probability | Basic odds, independent events, Bayes' rule and binomial results. |
| How many possible selections or orders exist? | Combinations & Permutations | Counts where order matters or does not matter, with or without repetition. |
| Can I draw numbers, names or dice results? | Random Number Generator | Random integers, decimals, list picks and dice rolls. |
| Can I quickly inspect a CSV file? | CSV Quick Analyzer | Column summaries, missing or invalid values, duplicate rows and a correlation between the first two numeric columns. |
Flowchart 1: Find the right tool
1. What is your question?Describe the result you need.
→
Understand numbers?Use Statistics, Percentage Change, Weighted Average or Z-Score.
→
Chance or choices?Use Probability or Combinations & Permutations.
→
Generate or inspect data?Use the Random Number Generator or CSV Quick Analyzer.
This is a choice guide, not a calculation. You can switch tools if your question changes.
1. Descriptive Statistics Calculator: understand a set of numbers
Descriptive statistics helps summarise a dataset. Instead of scanning every value, you can review central values, spread and possible unusual values. This can be useful for class scores, survey numbers, sales totals, measurements or simple research datasets.
What can it calculate?
- Mean: the arithmetic average.
- Median: the middle value after sorting the numbers.
- Mode: the most repeated value, or a note when no value repeats.
- Minimum, maximum and range: the low and high values and the difference between them.
- Quartiles and IQR: values that describe the spread of the middle part of the dataset.
- Variance and standard deviation: measures of how spread out the values are.
- Skewness, excess kurtosis, geometric mean, standard error and coefficient of variation: extra summaries when the inputs support them.
- Outlier flags and a histogram: a visual summary of the distribution. The outlier rule uses the 1.5 × IQR fences.
- Custom percentile: enter a percentile from 0 to 100 to calculate that point in the sorted data.
Worked example · illustrative data
Inputs: 12, 18, 18, 23, 29, 35, 41
Mean: 25.14 (rounded to two decimal places). Median: 23. Mode: 18. Range: 41 − 12 = 29.
Quartiles: with the tool's linear-interpolation method, Q1 = 18 and Q3 = 32, so IQR = 14.
Your selected display precision can change how many decimal places are shown. This is an example dataset, not user-submitted data.
How to use it
- Enter numbers separated by commas, spaces, semicolons or new lines.
- Optionally enter a percentile from 0 to 100.
- Select Calculate and review the summary and histogram.
- Check the explanation to see how the values were calculated.
Important: the calculator allows up to 100,000 values. Population variance divides by the number of values; sample variance divides by one less than that number. These methods answer different questions, so choose the one that fits your data.
2. Percentage Change Calculator: compare increases and decreases
A percentage change calculator helps explain how one value differs from another. It can be useful for a price change, monthly revenue, a test result, a change in website visits or a before-and-after comparison.
The tool has four modes: percentage change from an original value to a new value, increase or decrease a value by a percentage, find the original value before a known change, and percentage difference between two values.
Percentage change = (new value − original value) ÷ |original value| × 100Worked example
Original value: 100. New value: 135.
Change = 135 − 100 = 35. Percentage change = 35 ÷ 100 × 100 = +35%.
If a value becomes 230 after a 15% increase, reversing that increase gives 230 ÷ 1.15 = 200.
Do not mix up percentage change and percentage difference
Percentage change compares a new value with a chosen original value. Percentage difference compares two values without treating one as the original; this tool divides the absolute difference by the average of their absolute values.
Flowchart 2: choose the percentage method
What do you know?Pick the information already available.
→
Old + new valuesCalculate percentage change.
→
Starting value + %Apply an increase or decrease.
→
After-change value + %Reverse the percentage to estimate the original.
If neither value is the original, choose percentage difference instead. The original value cannot be zero for the percentage-change calculation, and a 100% decrease cannot be reversed to a unique original value from zero alone.
3. Weighted Average Calculator: give each value the right influence
A simple average treats every value equally. A weighted average gives values different levels of influence. Common examples include grades with different assessment weights, a basket of items with different quantities or a group score where some parts count more than others.
Weighted average = sum(value × weight) ÷ sum(weights)Worked example · illustrative scores
Values: 80, 90, 75. Weights: 2, 3, 1.
Weighted total = (80 × 2) + (90 × 3) + (75 × 1) = 505. Total weight = 6. Weighted average = 505 ÷ 6 = 84.17.
The tool can also calculate the score needed on a remaining item to reach a target average. With the example above, target 85 and remaining weight 2, the required score is (85 × 8 − 505) ÷ 2 = 87.5.
How to use it
- Enter the values and enter one matching weight for each value.
- Choose whether weights are raw numbers or percentages.
- For a target-score calculation, enter the target average and the remaining item's weight.
- Review the weighted mean, contributions and calculation steps.
Weights must be non-negative. When you choose percentage weights, current weights must total 100% for the weighted-average mode; for the target mode, current and remaining weights together must total 100%. A required score can be outside the range your course or scoring system allows, so compare it with the real maximum.
4. Z-Score Calculator: compare a value with an average
A z-score describes how many standard deviations a value is above or below a mean. A positive score is above the mean; a negative score is below it. Z-scores can help compare observations on the same scale when the relevant distribution assumptions make sense.
z = (observed value − mean) ÷ standard deviationWorked example
Observed value: 85. Mean: 75. Standard deviation: 8.
z = (85 − 75) ÷ 8 = 1.25. In a normal-distribution model, that is approximately the 89th percentile (about 89.4%).
The calculator can calculate a z-score from a value, a value from a z-score, a z-score from a percentile, and the modeled probability between two values. The probability outputs use a normal-distribution calculation, so they should not be treated as proof that real-world data follow a normal distribution.
Common mistake: a z-score alone does not show that a value is incorrect or important. Interpret it with the dataset, measurement method and context. The standard deviation must be greater than zero.
5. Probability Calculator: understand chances and outcomes
Probability expresses how likely an event is, from 0% (impossible under the model) to 100% (certain under the model). The calculator supports basic probability, several independent events, Bayes' rule and binomial probability.
A
Basic probability
Enter favourable outcomes and total outcomes. For a fair six-sided die, an even result has 3 favourable outcomes out of 6, so the chance is 50%.
B
Independent events
Enter one percentage per event. The tool estimates the chance at least one happens, all happen, none happen, and the number of events that happen.
C
Bayes' rule
Enter the prior chance of A and the conditional chances of B when A is true or not true. The result updates the chance of A after B is observed.
D
Binomial probability
Enter the number of trials, the number of successes and the chance of success on each trial to calculate exactly-k and cumulative probabilities.
Flowchart 3: pick the probability model
Describe the eventKnow the outcomes or model first.
→
Count outcomes?Use Basic Probability.
→
Several independent events?Use Independent Events.
→
Updated belief or repeated trials?Choose Bayes' Rule or Binomial.
Independent-events calculations assume the events do not affect one another. Binomial calculations use a fixed number of trials with the same success probability and the usual independence assumption. If these assumptions do not fit your situation, a numerical result may be misleading.
6. Combinations & Permutations Calculator: count possible selections
Combinations count selections where order does not matter. Permutations count arrangements where order matters. These calculations can support puzzle design, sample selection, schedule planning or learning combinatorics.
| Situation | Does order matter? | Model |
|---|---|---|
| Choose 3 people from a group of 10 | No | Combination, nCr |
| Assign 1st, 2nd and 3rd place from 10 people | Yes | Permutation, nPr |
Worked example
Choose 3 from 10 with no repetition: 10C3 = 120 combinations. If the order of the 3 selected people matters, 10P3 = 720 permutations.
The tool also reports factorials and formulas for selections with repetition. It accepts whole-number inputs from 0 to 5,000. Very large results may be shortened visually for readability; the tool uses integer arithmetic for these combinatoric counts rather than ordinary floating-point rounding.
7. Random Number Generator: draw numbers, names and dice results
The Random Number Generator supports integer draws, decimal draws, random picks from a list and dice rolls. It is useful for classroom examples, games, simple sampling and other situations where you need random selections.
- Integers: set a minimum and maximum, choose how many to generate, and optionally prevent repeats or sort the results.
- Decimals: set the range and number of decimal places.
- List picks: paste one item per line and choose whether a selection can repeat.
- Dice: choose the number of dice, sides per die and an optional plus or minus modifier.
Flowchart 4: generate a random result
Choose a draw typeIntegers, decimals, list or dice.
→
Set your limitsRange, count, items or dice sides.
→
Choose repeat rulesUnique or repeatable, where offered.
→
Generate and reviewCopy or download the result if needed.
The tool uses the browser's Web Crypto random-number generator and rejection sampling for unbiased integer draws when the browser supports it. This is not the same as a complete audited lottery or gambling platform; use a properly reviewed system for regulated or high-stakes drawings. The generator requires browser support for secure random generation.
8. CSV Quick Analyzer: inspect a CSV file in your browser
A CSV file stores table-like data as rows and columns. The CSV Quick Analyzer helps you get a quick first look at a dataset without manually counting every cell. You can paste data or load a local CSV or text file.
What the analyzer reports
- Column type: numeric or text.
- Valid values and missing or invalid cells.
- For numeric columns: sum, mean, median, minimum, maximum and sample standard deviation.
- For text columns: unique-value count and the most frequent value.
- Exact duplicate rows.
- Correlation between the first two numeric columns, using rows where both values are available.
Flowchart 5: from CSV file to a useful summary
1. Paste or load dataUse a CSV or supported text table.
→
2. Check formatReview delimiter and header detection.
→
3. Inspect the summaryLook for missing values, invalid cells and duplicates.
→
4. Interpret carefullyCheck data quality before making a decision.
Privacy and file limits: in this tool, CSV text and file reading are processed in the browser; the code does not send the file to a server. The current file-input limit is 2 MB, with limits of 50,000 rows and 60 columns. Use the tool only with data you are allowed to process, and avoid putting personal or confidential details into public webpages or shared devices.
The analyzer auto-detects common delimiters such as commas, semicolons, tabs and pipes, and can automatically detect or let you choose whether the first row is a header. A column is treated as numeric when at least 80% of its filled cells look numeric. That means unusual formats may need cleaning first. Correlation is a relationship measure, not proof that one value causes another.
Practical tip: before acting on a CSV summary, check whether the file has the expected number of columns, whether the first row is a header, and whether blanks or text values should really be treated as missing or invalid.
One simple workflow for better data decisions
A calculator gives you an answer to a defined question. It cannot automatically decide whether your input is correct or whether the result makes sense in real life. Use this short review workflow whenever the answer matters.
QuestionDefine what you want to learn.
→
InputsCheck values, units and missing data.
→
CalculationChoose a fitting method.
→
ReviewRead the working and assumptions.
→
DecisionUse context, not the number alone.
- Write down what each number represents.
- Check units, percentages and the meaning of weights.
- Review missing values and unusual observations.
- Read the calculation method and assumptions.
- Repeat the calculation with a small example you can verify by hand.
Ready to work with your data?
Open the Data & Productivity suite, choose a calculator, and review the method alongside the result.
Content note: This guide describes the supplied Orixiva tool code. Example values are illustrative. A calculator can check arithmetic, but it cannot decide whether the input data or the assumptions are appropriate for every real-world situation.
Frequently asked questions
These are editorial questions written to help readers understand the tool; they are not presented as submissions from real users.
What are data and productivity calculators?
They are small tools that help answer common number, statistics, probability, random-selection and data-checking questions. Orixiva's Data & Productivity suite contains eight calculators in one browser-based interface.
Do I need to install software or create an account?
The supplied tool is designed to run in a modern browser and does not require a third-party API for its calculations. You can open the calculator page and select the function you need.
What numbers can I enter in Descriptive Statistics?
Enter values separated by commas, spaces, semicolons or new lines. The calculator accepts up to 100,000 values and reports a range of summary statistics.
What is the difference between mean, median and mode?
The mean is the sum divided by the number of values. The median is the middle value after sorting. The mode is the value that appears most often.
Why are sample and population standard deviation different?
They use different variance denominators. Population variance divides by the number of values, while sample variance divides by one less. Choose the method that matches whether your data represent the whole group or a sample from a larger group.
How does the outlier flag work?
The tool flags values below Q1 − 1.5 × IQR or above Q3 + 1.5 × IQR. A flagged value is not automatically wrong; investigate it in context.
How do I calculate percentage change?
Subtract the original value from the new value, divide by the absolute original value, and multiply by 100. The original value cannot be zero for this calculation.
Is percentage change the same as percentage difference?
No. Percentage change uses a chosen original value as the base. Percentage difference compares two values using their average absolute size as the base.
Can I work backwards from a percentage increase?
Yes. Select the mode for finding the original value, enter the final value and the percentage change, and choose increase or decrease. A 100% decrease leads to zero, so the original value cannot be recovered from that final value alone.
Why does a weighted average differ from a simple average?
A weighted average gives each value influence according to its weight. A simple average treats each value equally. If larger weights belong to higher values, the weighted average may be higher than the simple mean.
Must my weighted percentages total 100%?
Yes, when you choose percentage weights, the weighted-average mode expects the weights to total 100%. In the target-score mode, the existing and remaining percentage weights must total 100% together.
What does a z-score of 1.25 mean?
It means the value is 1.25 standard deviations above the mean. A percentile or probability interpretation assumes the selected normal-distribution model is suitable.
Does the z-score calculator prove my data follow a normal distribution?
No. It calculates normal-distribution probabilities from the mean, standard deviation and entered values. It does not test or prove that the real dataset follows a normal distribution.
How do I calculate basic probability?
Enter the number of favourable outcomes and the total possible outcomes. For equally likely outcomes, divide favourable outcomes by total outcomes and multiply by 100 to express the chance as a percentage.
When should I use Bayes' rule?
Use it when you want to update the probability of an event after observing another event and you know the required prior and conditional probabilities. The output is only as good as the assumptions and inputs.
What is the difference between combinations and permutations?
Combinations count selections where order does not matter. Permutations count arrangements where order matters. For example, choosing three people is a combination; assigning first, second and third place is a permutation.
Can the random generator select names without repeats?
Yes. In list mode, choose unique picks to prevent selecting the same list entry more than once. The list must contain enough non-empty entries for the number of picks requested.
Are generated numbers random?
The tool uses the browser's Web Crypto random generator when available and uses rejection sampling for unbiased integer draws. For regulated or high-stakes selection processes, use a system with suitable independent review and controls.
What file types can the CSV Quick Analyzer read?
You can paste CSV or supported text data, or load a local CSV or text file. The file input accepts common CSV and text extensions, and the current size limit is 2 MB.
Does the CSV analyzer upload my file?
The supplied code reads the file in the browser and processes the contents locally; it does not send the dataset to a server. Be careful on shared devices and only process data you are allowed to use.
Why does the CSV analyzer mark some cells as invalid?
It classifies a column as numeric when at least 80% of its filled cells look numeric. If a numeric column also contains text, that text may be counted as invalid. Review the column format and clean the data if needed.
Can the CSV analyzer remove duplicate rows automatically?
The tool reports the number of exact duplicate rows in its summary. It does not automatically clean or rewrite your source file.
Does correlation mean one column causes another?
No. Correlation describes how two numeric columns vary together in the rows that can be compared. It does not by itself establish cause and effect.
Can I use the results for research or business decisions?
You can use them as a helpful first analysis, but check the data quality, calculation assumptions and context before making a high-impact decision. For regulated, clinical, financial or other high-stakes work, use appropriate professional review.
Does Orixiva save my calculations?
The supplied tool keeps recent calculation history in the current page session and offers copy or download options for results. The CSV content is processed locally, and the provided code does not upload it to a server.
Help improve this guide
Was this guide helpful? Tell Orixiva which calculator or explanation could be clearer. This is a proposed feedback prompt only; this HTML block does not send or store submissions. To collect comments, configure a WordPress comments feature or a form with submission handling, spam protection, moderation and a suitable privacy notice.