Try our free AI tools – no sign-up needed!


T-Test Explained: How to Calculate and Read a p-Value (With Worked Examples)
Short answer: A t-test checks whether the difference between means is larger than you would expect from random variation. It gives a t statistic and a p-value. If the p-value is below your chosen significance level (usually 0.05), the difference is called statistically significant. Always report the effect size and a confidence interval too. You can run one-sample, two-sample (Welch or pooled) and paired t-tests for free with the Orixiva statistics calculator.
Key takeaways
- Pick the right test: one-sample, independent two-sample (Welch is the safe default) or paired.
- The p-value is the probability of a result at least this extreme if there were really no difference.
- p < 0.05 does not mean "important". Check the effect size and confidence interval.
- Check assumptions: independent observations, roughly normal data or a large enough sample.
What does a t-test do?
A t-test compares means while taking variability and sample size into account. It answers questions such as "Did the new teaching method raise exam scores?" or "Is the average fill weight different from 500 g?"
Every t-test starts with two hypotheses:
- Null hypothesis (H₀): there is no difference (the means are equal).
- Alternative hypothesis (H₁): there is a difference (or, for a one-tailed test, a difference in a stated direction).
The t statistic measures how many standard errors the observed difference is away from zero. The bigger it is, the less likely the difference is due to chance alone.
Which t-test should you use?
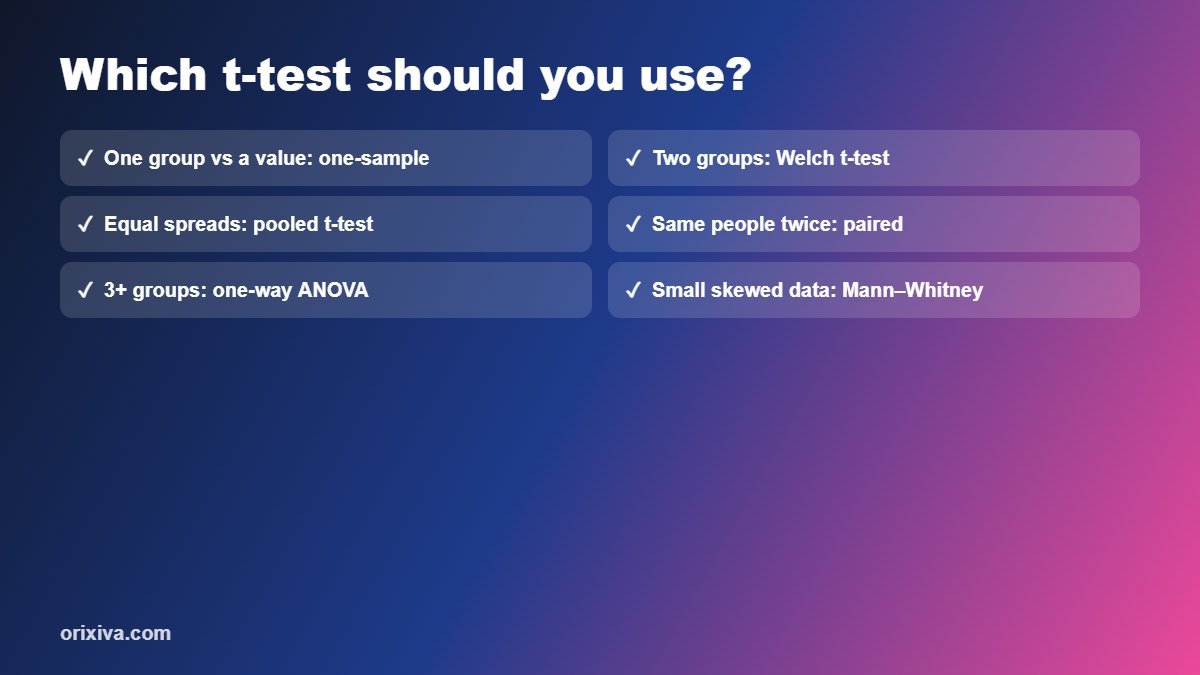
| Your data | Test | Example |
|---|---|---|
| One group vs a known value | One-sample t-test | Average delivery time vs a 30-minute promise |
| Two separate groups | Welch two-sample t-test (default) | Class A vs class B exam scores |
| Two separate groups with similar spread | Pooled (Student's) t-test | Two machines with equal variance |
| Same people measured twice | Paired t-test | Weight before and after a programme |
| Three or more groups | One-way ANOVA (not several t-tests) | Three fertilisers on crop yield |
Why Welch? Welch's t-test does not assume equal variances, and when variances are equal it performs almost as well as the pooled test. Many statisticians recommend it as the default for independent groups.
The t-test formulas
- One-sample: t = (x̄ − μ₀) ÷ (s ÷ √n), with n − 1 degrees of freedom.
- Welch two-sample: t = (x̄₁ − x̄₂) ÷ √(s₁²/n₁ + s₂²/n₂), with Welch–Satterthwaite degrees of freedom.
- Paired: compute each difference, then run a one-sample t-test on the differences against 0.
Here x̄ is a sample mean, s a sample standard deviation, n the sample size and μ₀ the value you test against.
Example 1: one-sample t-test
A coffee shop claims an average wait of 50 seconds. You time 10 orders: mean 52.3 s, standard deviation 4.1 s. Is the wait different from 50 s?
- Standard error: 4.1 ÷ √10 = 1.297.
- t statistic: (52.3 − 50) ÷ 1.297 = 1.77, with 9 degrees of freedom.
- p-value (two-tailed): about 0.11.
- Decision: 0.11 is above 0.05, so there is not enough evidence that the average wait differs from 50 s.
This does not prove the wait is exactly 50 s. With only 10 orders, the test may simply lack the power to detect a small difference.
Example 2: two-sample Welch t-test
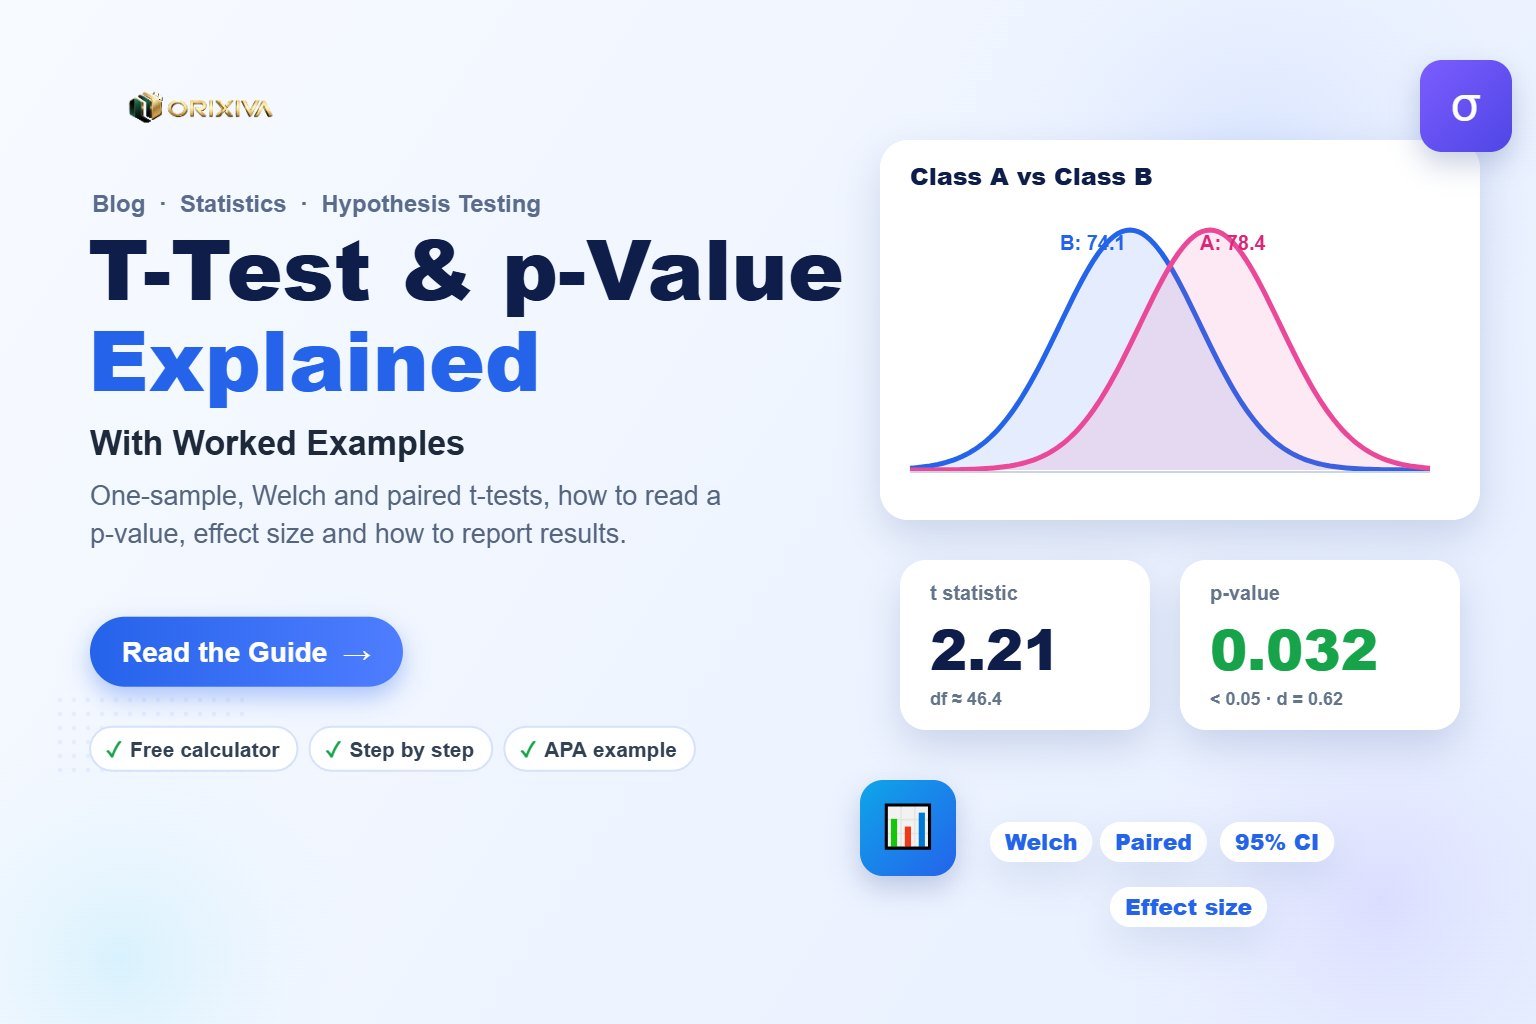
Two classes of 25 students take the same exam. Class A: mean 78.4, SD 6.2. Class B: mean 74.1, SD 7.5.
- Difference in means: 78.4 − 74.1 = 4.3 points.
- Standard error: √(6.2²/25 + 7.5²/25) = 1.95.
- t statistic: 4.3 ÷ 1.95 = 2.21, with about 46.4 degrees of freedom.
- p-value: about 0.032, below 0.05.
- 95% confidence interval: about 0.4 to 8.2 points.
- Effect size (Cohen's d): about 0.62, a medium effect.
Conclusion: class A scored significantly higher. The interval shows the true difference could be small (0.4) or substantial (8.2), so a larger study would give a more precise answer.
How to read a p-value correctly
✅ The p-value is…
The probability of seeing a difference at least this large if the null hypothesis were true.
❌ The p-value is not…
The probability that the null hypothesis is true, or the size or importance of the effect.
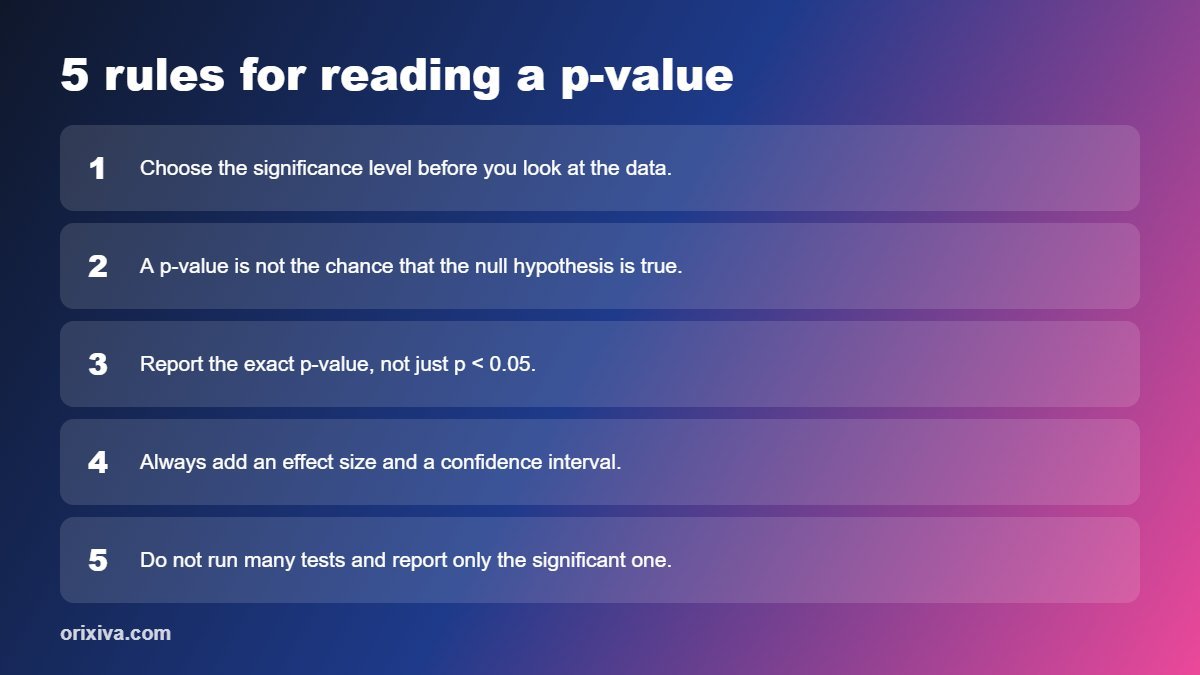
- Choose α before you look at the data, usually 0.05.
- Report the exact p-value (p = 0.032) rather than only "p < 0.05".
- Pair it with an effect size and a confidence interval to show how big the difference is.
- Do not run many tests and report only the significant one. Multiple tests raise the chance of false positives.
The American Statistical Association's statement on p-values makes the same points and is worth reading if you publish research.
Assumptions and what to do if they fail
| Assumption | How to check | If it fails |
|---|---|---|
| Independent observations | Study design | Use a paired test or a model for repeated measures |
| Roughly normal data (or differences) | Histogram, box plot, skewness | With large samples t-tests are robust; otherwise use Mann–Whitney or Wilcoxon |
| No extreme outliers | Box plot | Check for data errors; consider a non-parametric test |
| Equal variances (pooled test only) | Compare SDs | Use Welch's t-test |
The Descriptive Statistics tool in the calculator shows skewness, outliers, a histogram and a box plot, so you can check these before testing.
How to report a t-test (APA style example)
"Class A (M = 78.4, SD = 6.2) scored higher than class B (M = 74.1, SD = 7.5), Welch's t(46.4) = 2.21, p = .032, d = 0.62, 95% CI [0.4, 8.2]."
This one sentence gives readers the means, spread, test statistic, degrees of freedom, p-value, effect size and confidence interval.
Run your t-test in seconds
One-sample, Welch, pooled and paired t-tests with effect sizes, plus ANOVA, chi-square, regression and 22 statistics tools. Free, private and step-by-step.
Open the free statistics calculator →Frequently asked questions
What does a p-value of 0.05 mean?
It means that if there were truly no difference, you would see a result at least this extreme about 5% of the time. It is a common threshold, not a guarantee of importance.
When should I use a paired t-test?
Use a paired t-test when the same people or items are measured twice, such as before and after a treatment, or when each observation is matched with a partner.
What is the difference between Welch's and Student's t-test?
Student's (pooled) t-test assumes both groups have equal variances. Welch's t-test does not, which makes it a safer default for two independent groups.
What is a one-tailed vs two-tailed t-test?
A two-tailed test checks for a difference in either direction. A one-tailed test checks only one direction and should be chosen before seeing the data, with a clear reason.
How many samples do I need for a t-test?
There is no fixed minimum, but small samples have low power. Use a sample size calculator with your expected effect and variability to plan a study.
What if my data are not normally distributed?
With larger samples, t-tests are fairly robust. For small, skewed samples, consider the Mann–Whitney U test or the Wilcoxon signed-rank test.
Can I compare three groups with t-tests?
Use one-way ANOVA instead. Running several t-tests increases the chance of a false positive.
What is Cohen's d?
Cohen's d expresses the difference between means in standard deviation units. Rough guides are 0.2 small, 0.5 medium and 0.8 large, though context matters.
Over to you
Are you running a t-test for a thesis, an A/B test or quality control? Share your scenario (no private data) in the comments, and we will help you pick the right test. Common questions will be added to this guide.
Related guides and tools
- Free statistics calculator: t-tests, ANOVA, regression
- Data analysis calculator: z-scores and CSV
- Thesis Data Analysis Excel Template
- Data and productivity calculators guide
Sources: NIST/SEMATECH e-Handbook: Two-sample t-test · American Statistical Association statement on p-values (2016). Example values are rounded.

[…] T-test and p-value explained for lab results […]
[…] often more useful than a p-value because they show the size of the effect and its uncertainty. See t-test and p-value explained for the testing […]